The Analysis of relation to brain iron deposition of Parkinson’s Disease using Quantitative Susceptibility Mapping
Article information

Abstract
Objectives
This study aimed to investigate the levels of brain iron deposition in Parkinson’s disease (PD) patients using Quantitative Susceptibility Mapping (QSM) and to determine whether distinctions compared to the general population exist. Furthermore, we examined potential variations in iron deposition among different PD subtypes.
Methods
Structural brain imaging was conducted on 75 participants at Gangdong Kyung Hee University Hospital between August 2017 and May 2020. PD patients were categorized into Tremor Dominant (TD) and Postural Instability and Gait Difficulty (PIGD) subtypes. Voxel-based morphometry and QSM were employed to compare voxel-wise magnetic susceptibility across the entire brain between Normal Controls (NC) and PD groups. Subsequently, QSM values were compared between TD and PIGD groups.
Results
QSM values were compared among 46 PD patients and 23 normal controls, as well as between TD (n=22) and PIGD (n=24) groups. Voxel-based QSM analysis revealed no significant differences between groups. Similarly, ROI-based QSM analysis showed no significant distinctions.
Conclusions
No significant variations were observed between the PD patient group, NC group, or PD subtypes. This study systematically compared QSM values across a broad range of brain regions potentially linked to PD pathology. Additionally, the subdivision of the PD group into TD and PIGD subtypes for QSM-based iron deposition analysis represents a meaningful and innovative approach.
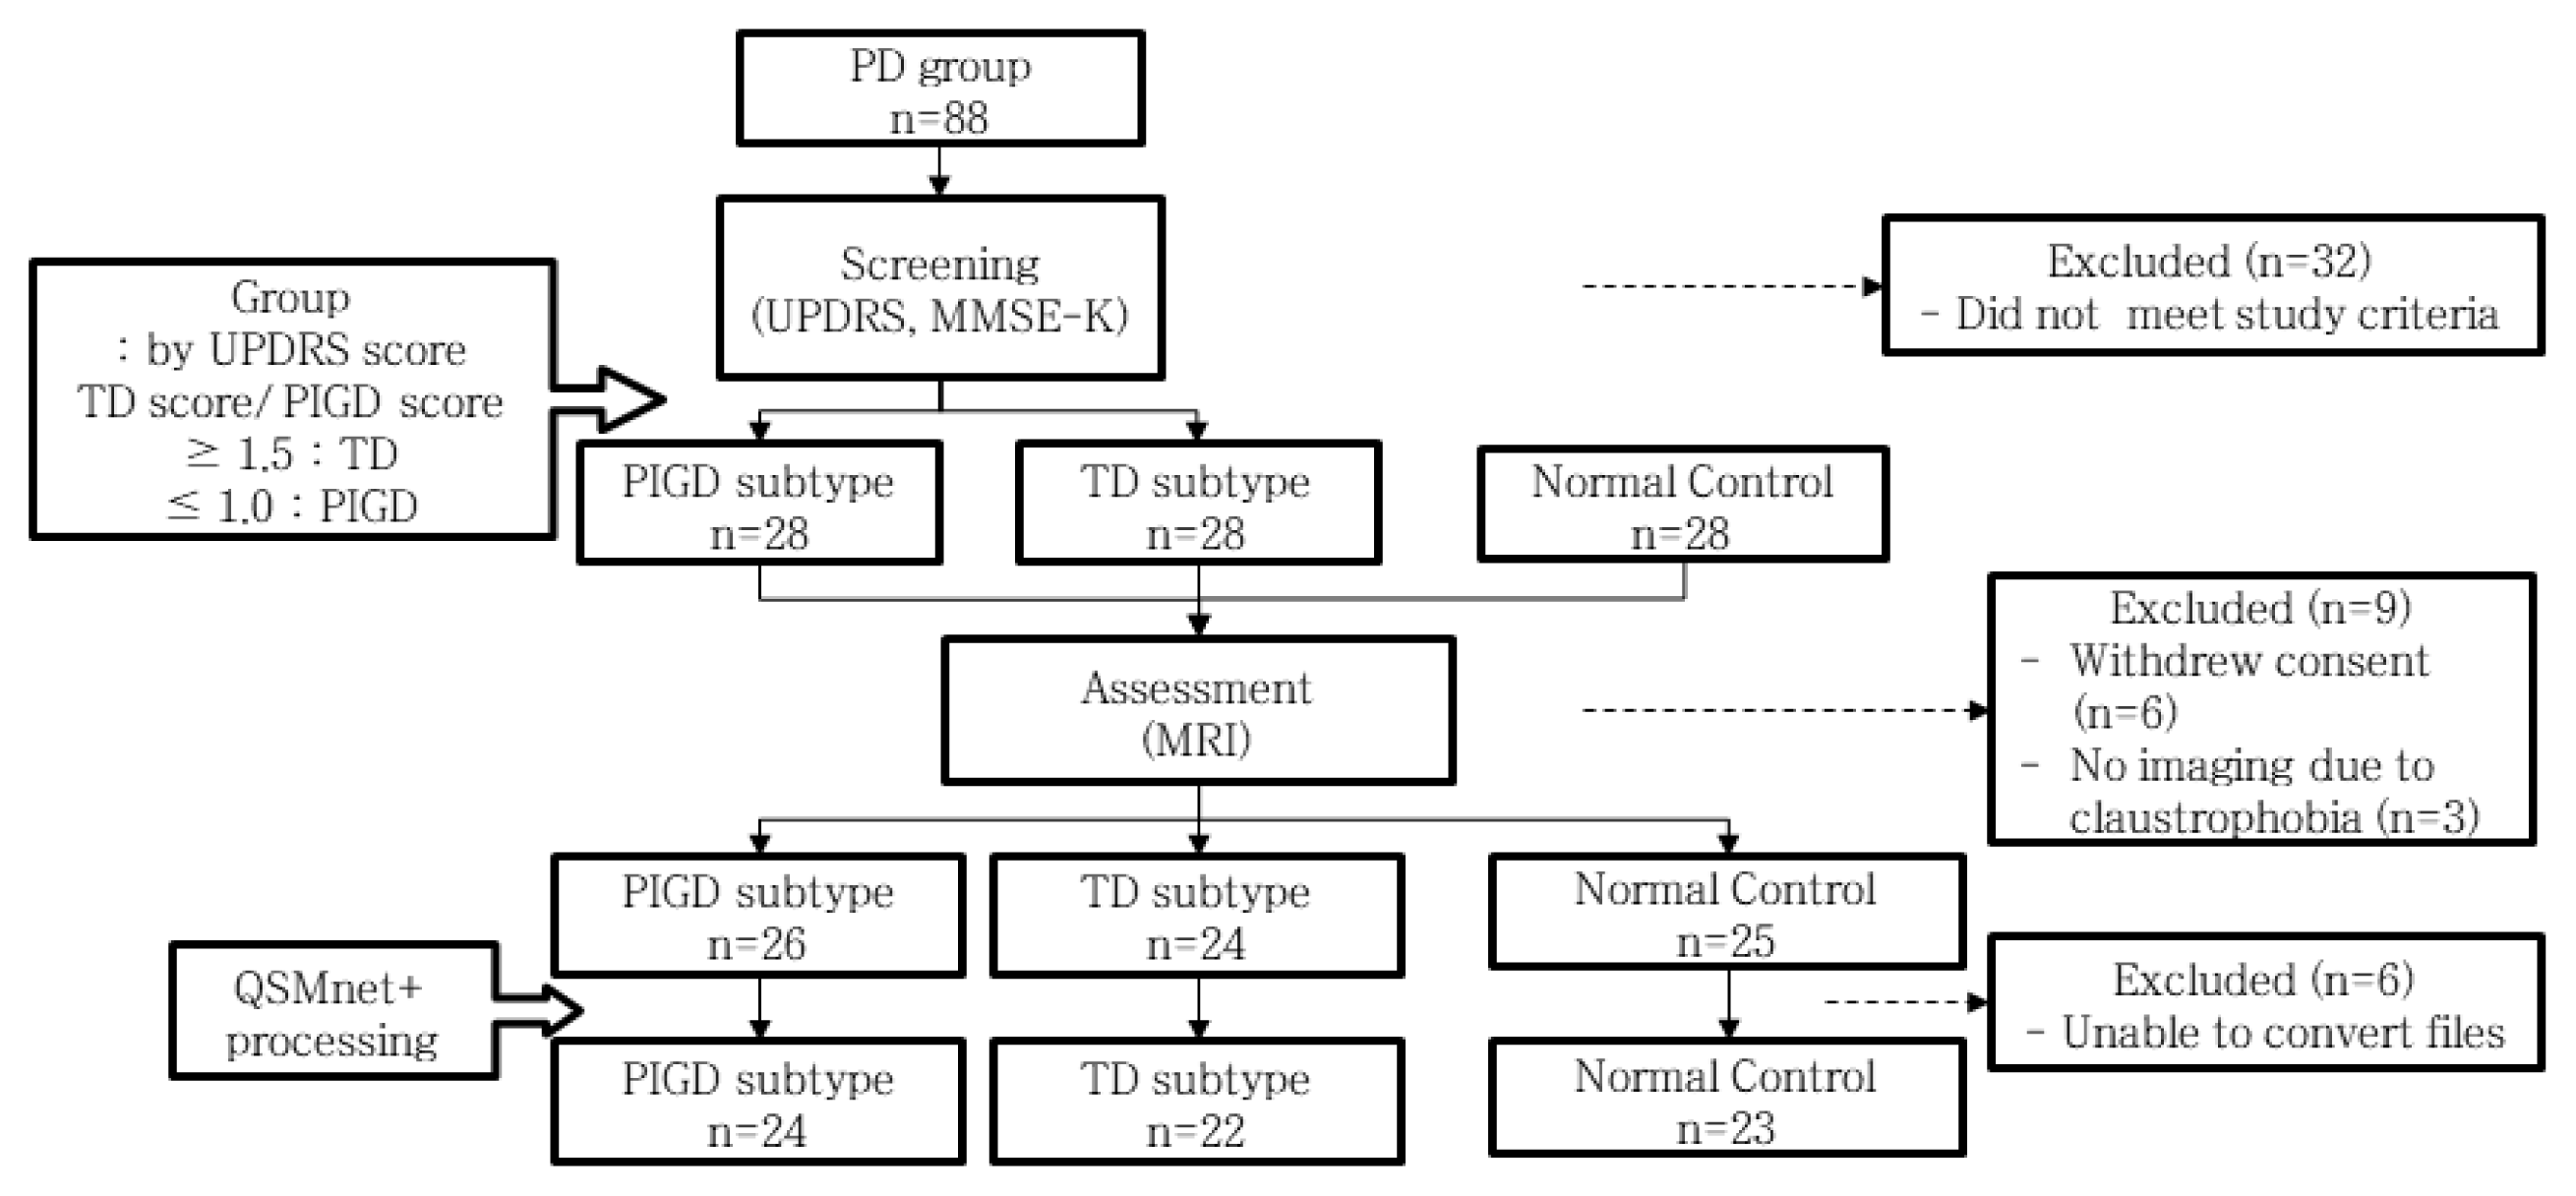
Study flow chart
UPDRS, Unified Parkinson’s Disease Rating Scale; MMSE-K, Korean version of Mini-Mental State Examination; TD, Tremor dominant; PIGD, Postural instablility and gait difficulty; QSM, Quantitative susceptibiltiy mapping
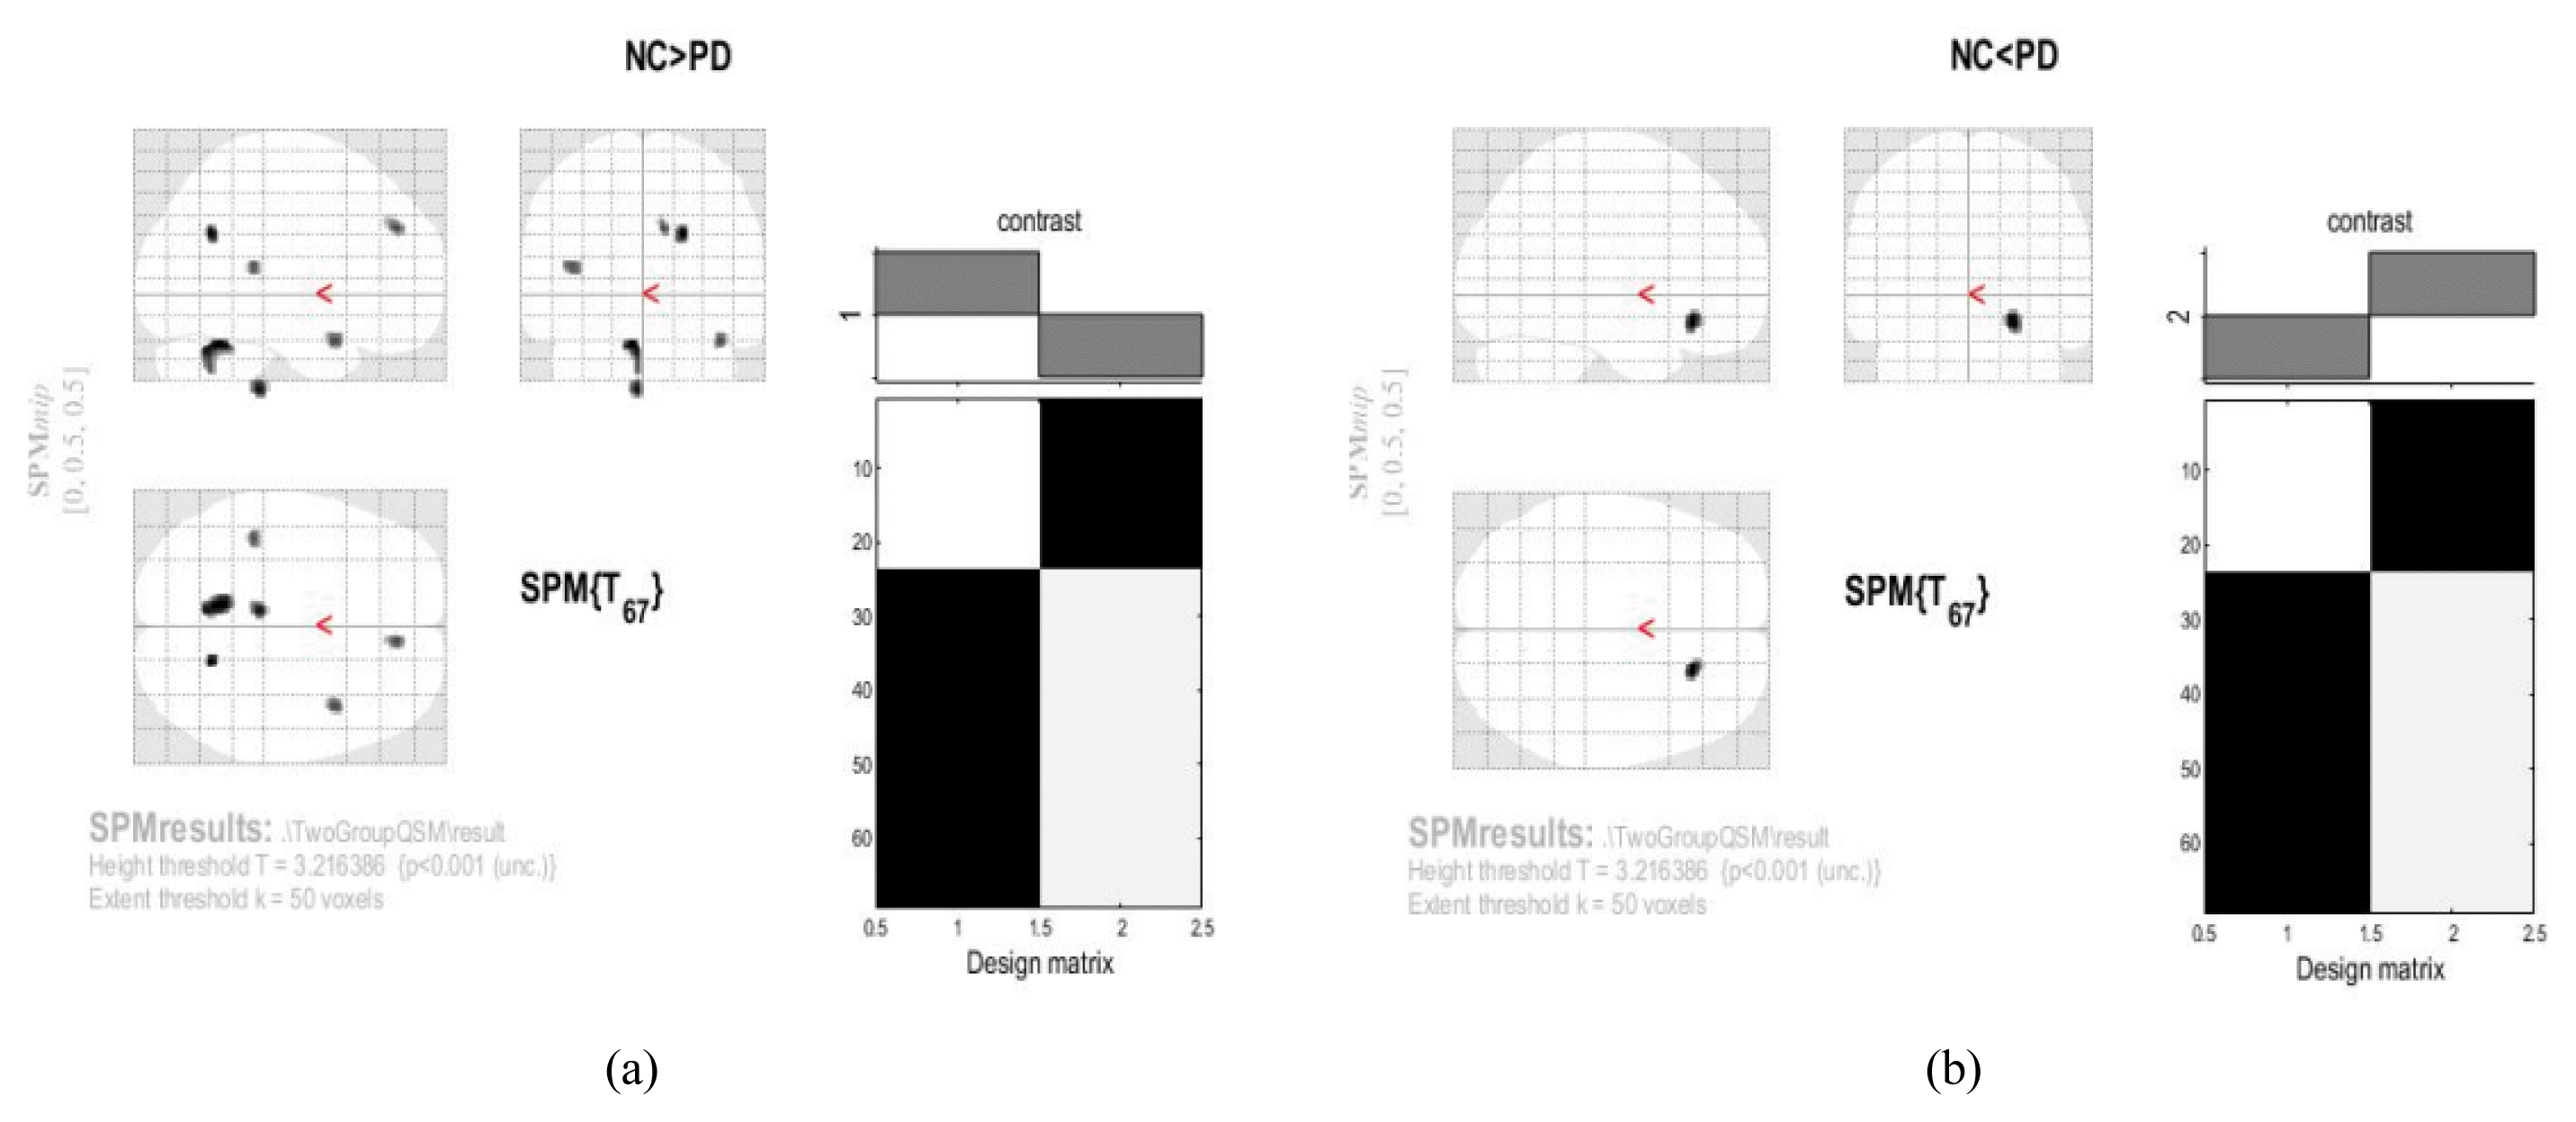
Voxel-based analysis of the area where increased QSM values between Normal control and PD group
(a), (b) SPM results: Height threshold T = 3.216386 {p<0.001(unc.)} Extent threshold k=50 voxels
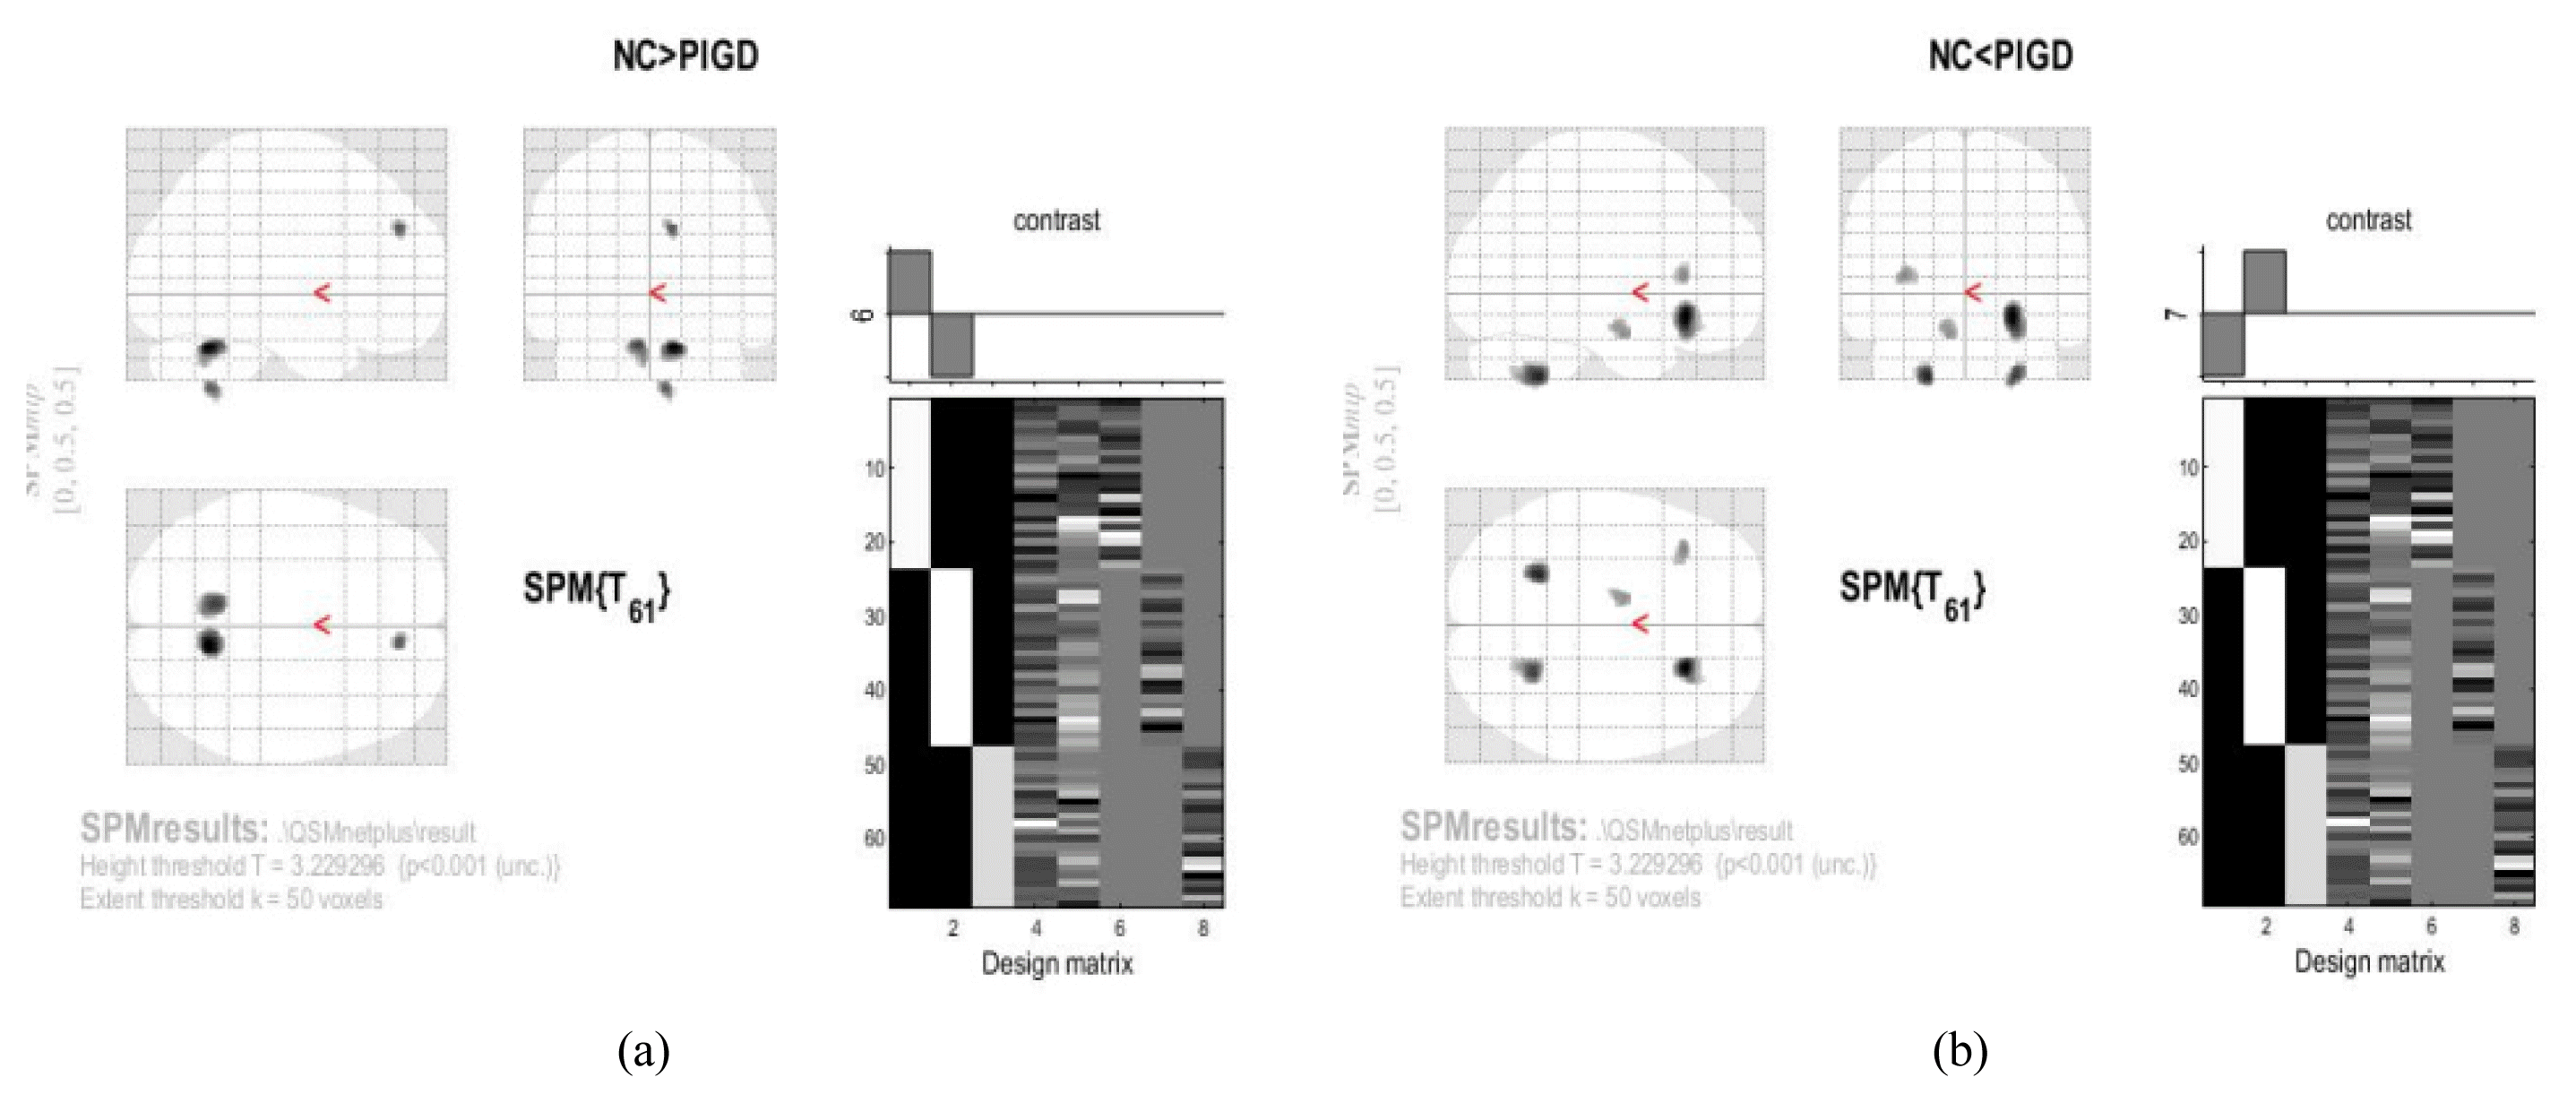
Voxel-based analysis of the area where increased QSM values between Normal control and PIGD group
(a), (b) SPM results: Height threshold T = 3.229296 {p<0.001(unc.)} Extent threshold k=50 voxels
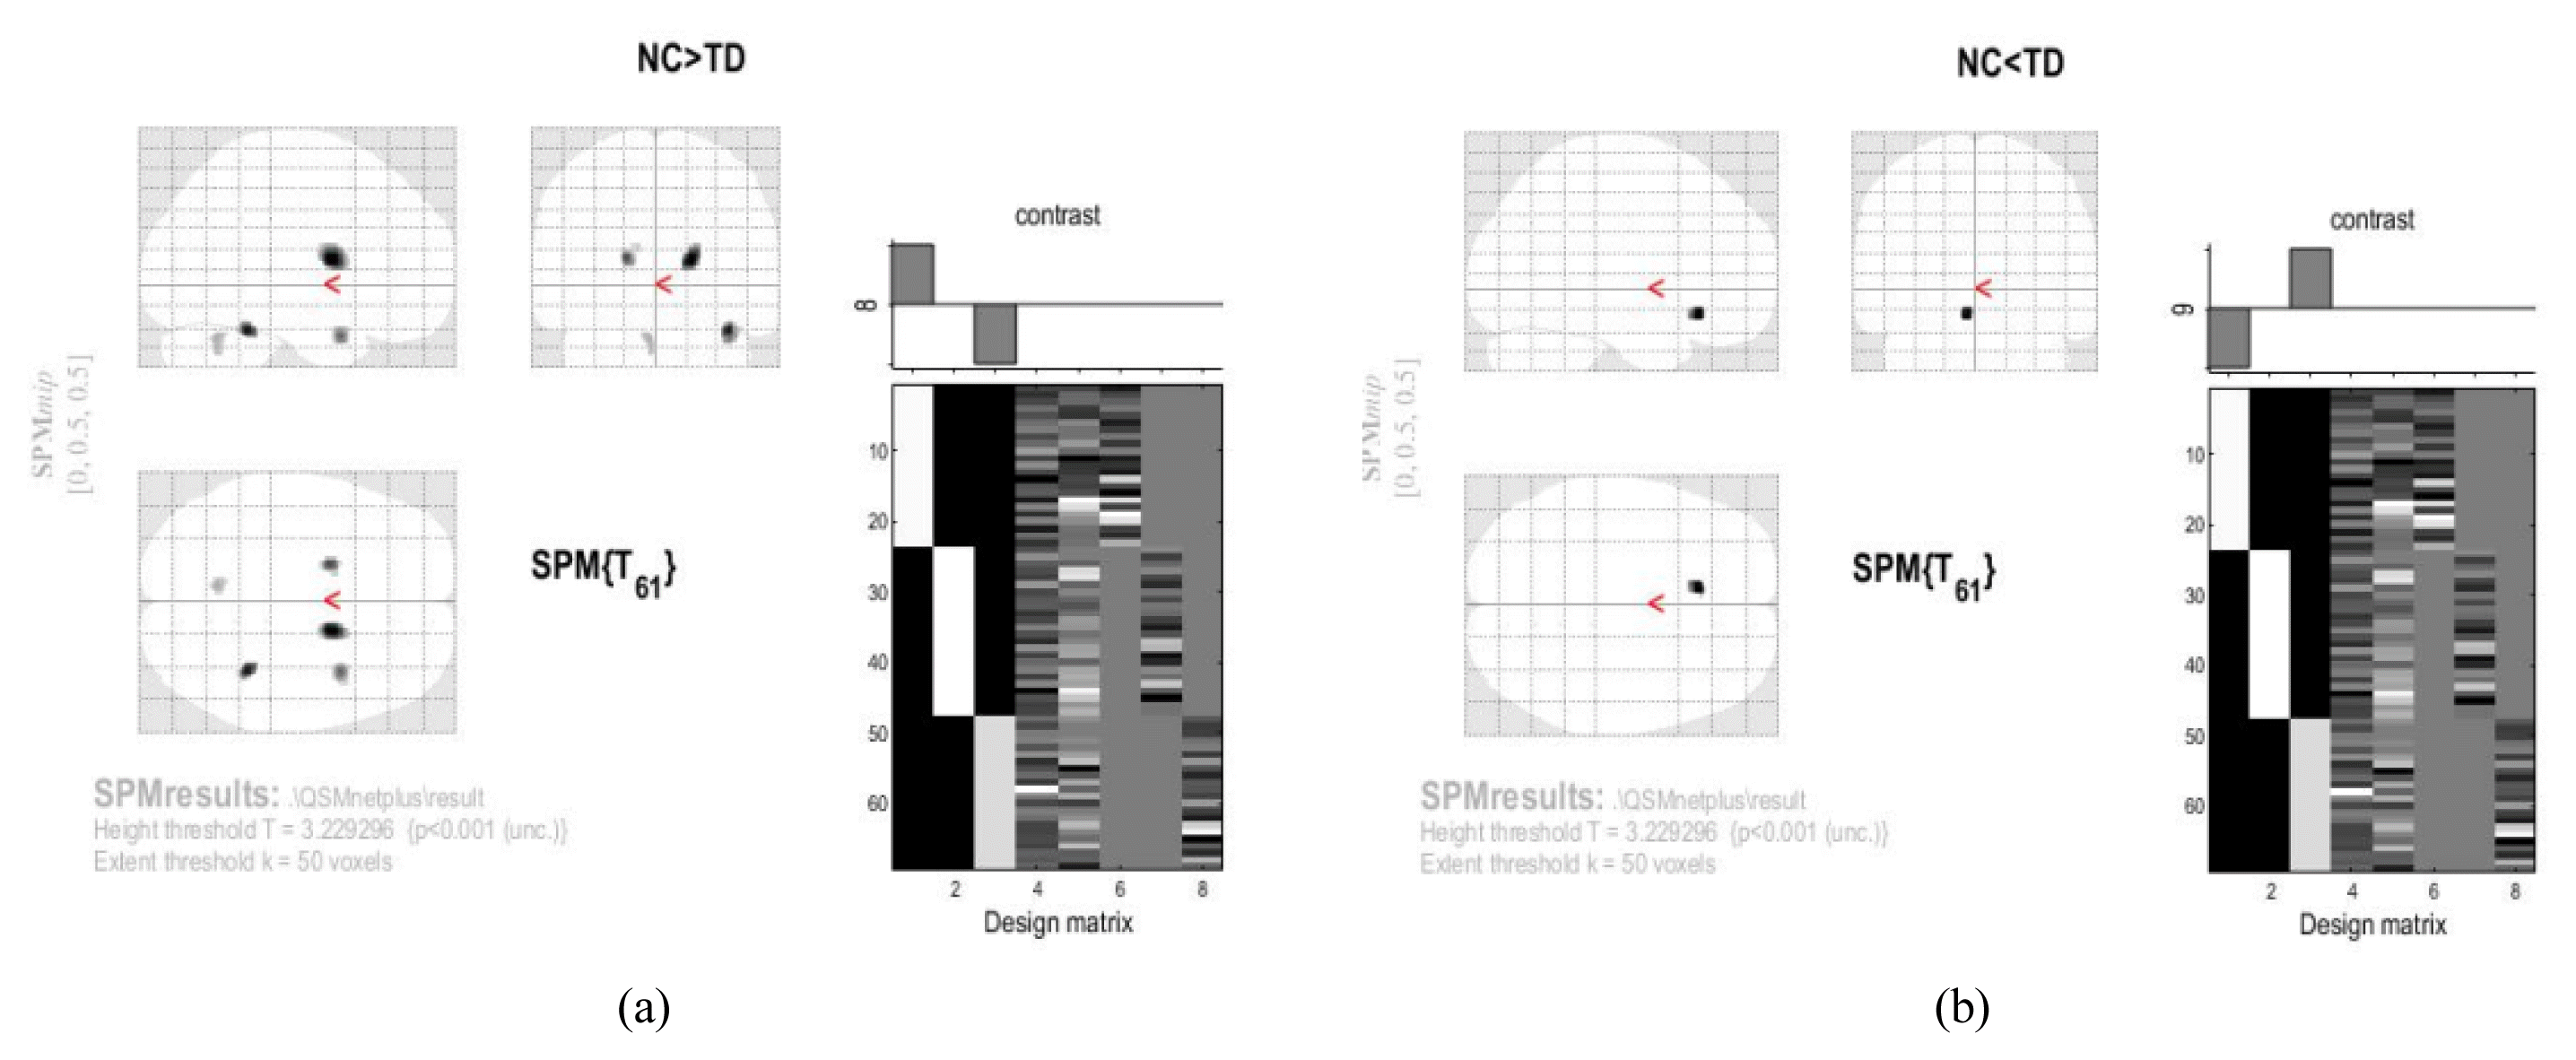
Voxel-based analysis of the area where increased QSM values between Normal control and Tremor dominant group
(a), (b) SPM results: Height threshold T = 3.229296 {p<0.001(unc.)} Extent threshold k=50 voxels
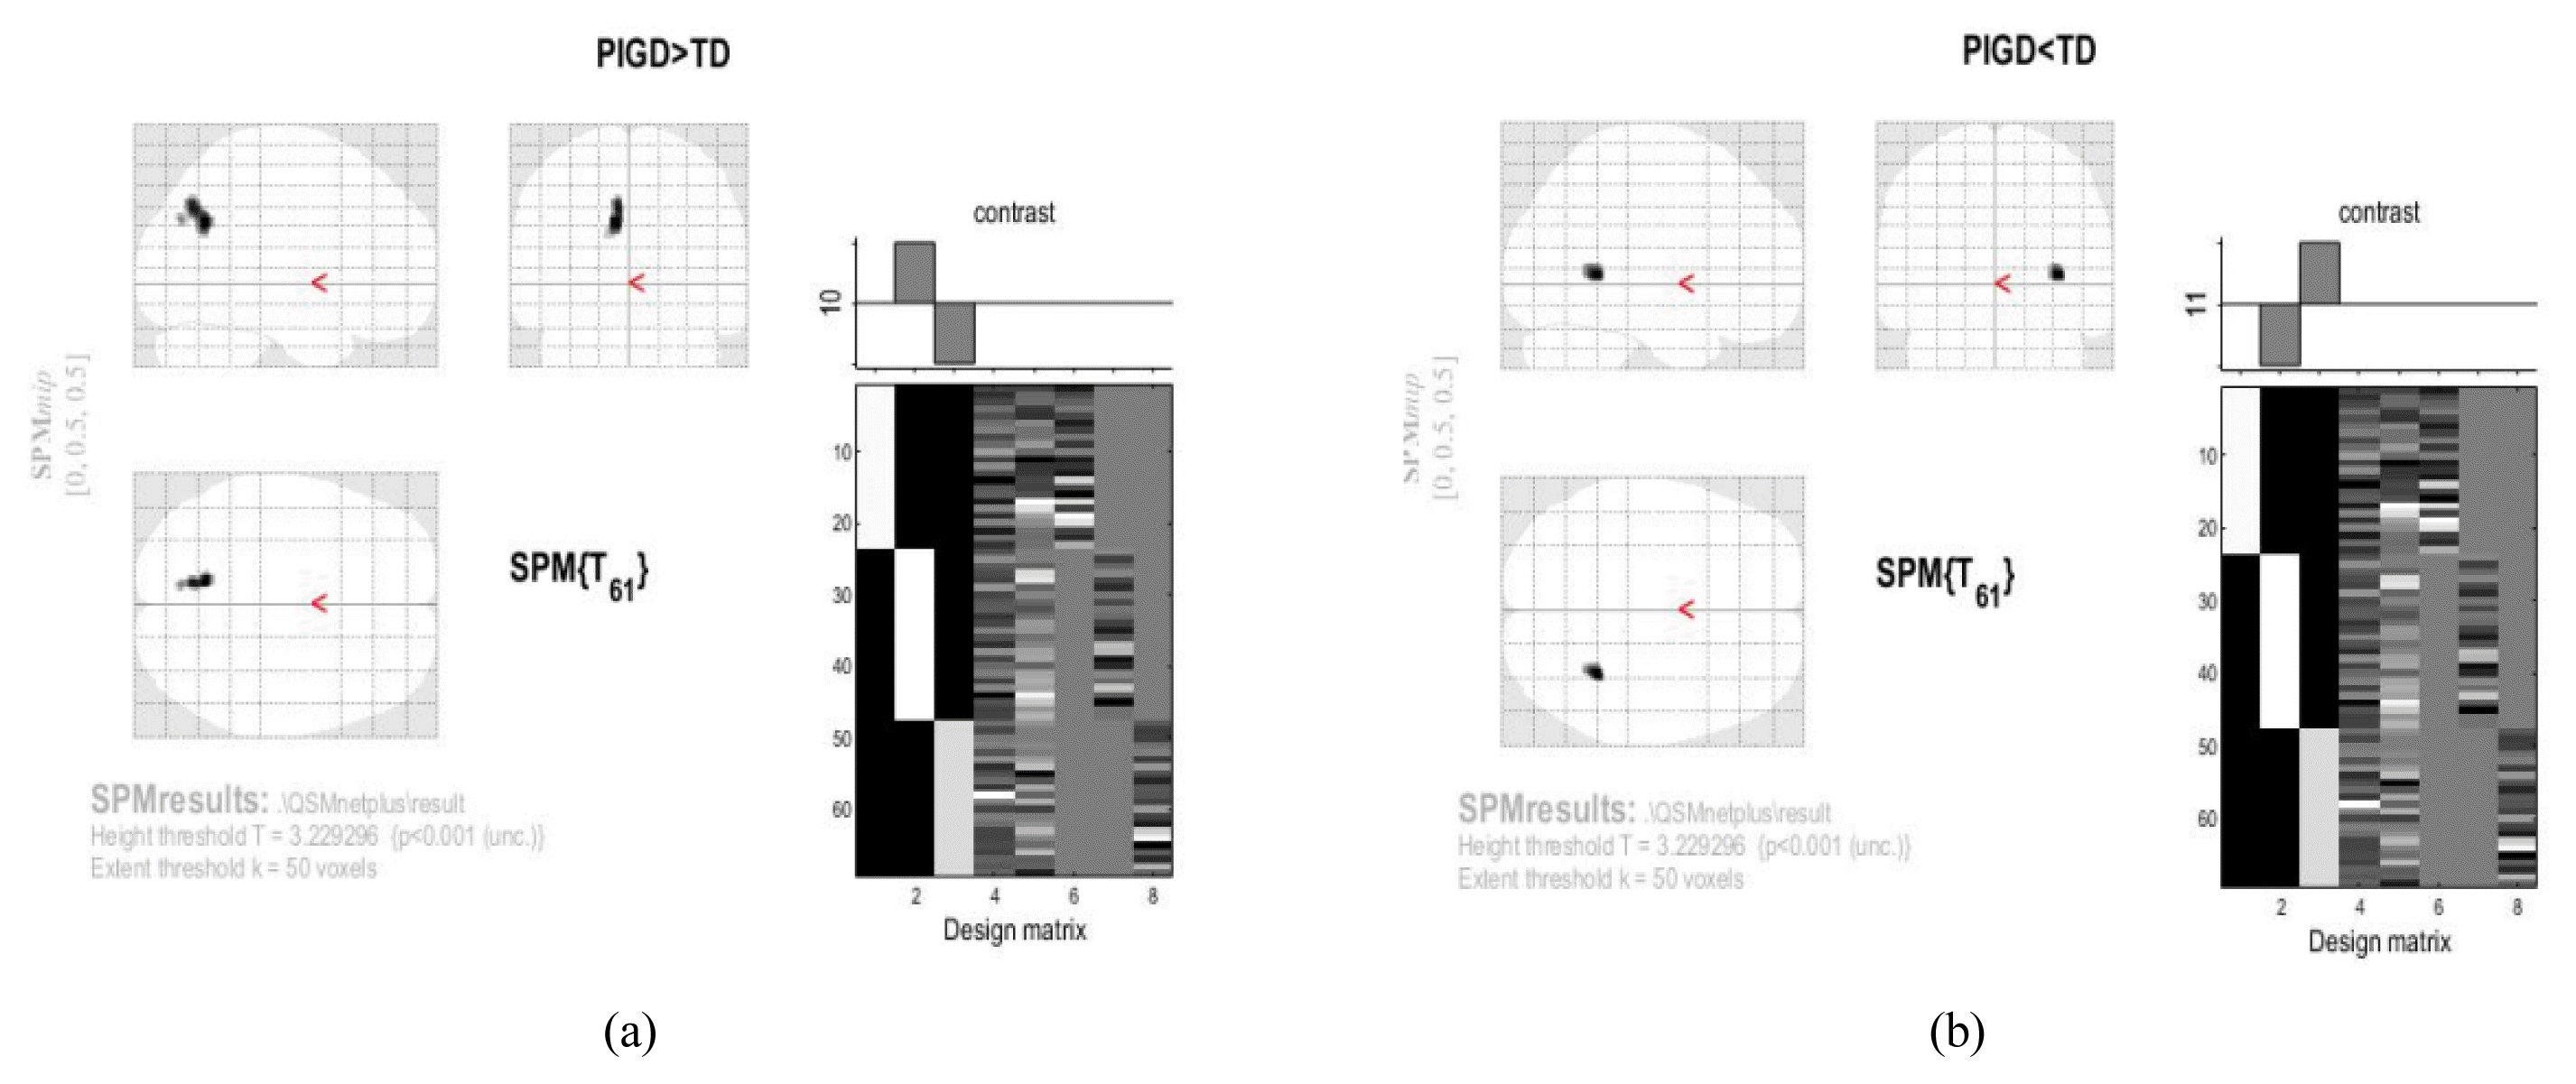
Voxel-based analysis of the area where increased QSM values between PIGD and Tremor dominant group
(a), (b) SPM results: Height threshold T = 3.229296 {p<0.001(unc.)} Extent threshold k=50 voxels
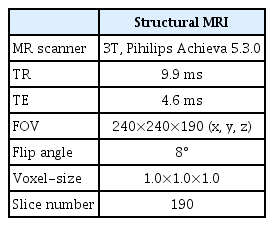
MRI Data Acquisition
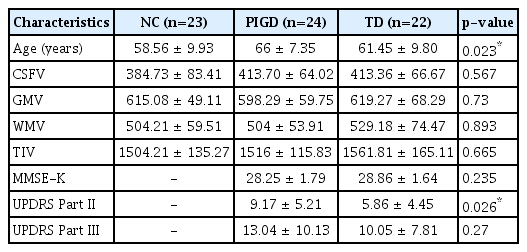
Baseline Characteristics of Participants
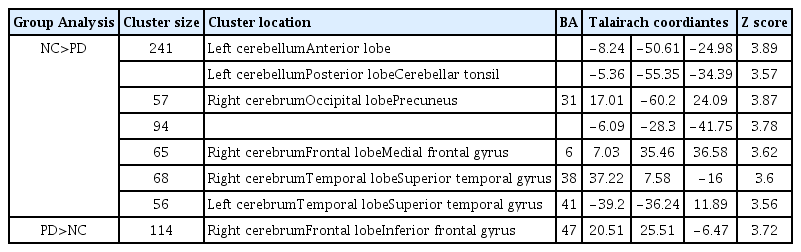
Comparison of QSM Values between Normal Control and PD Group
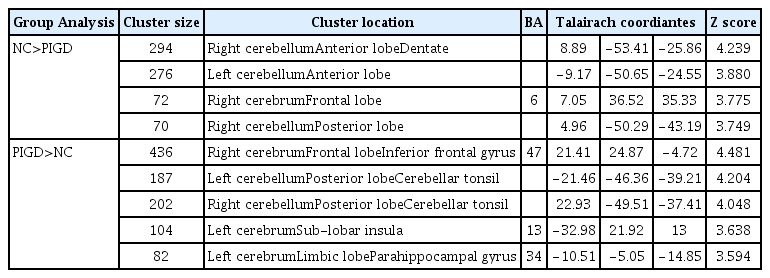
Comparison of QSM Values between Normal Control and PIGD Group
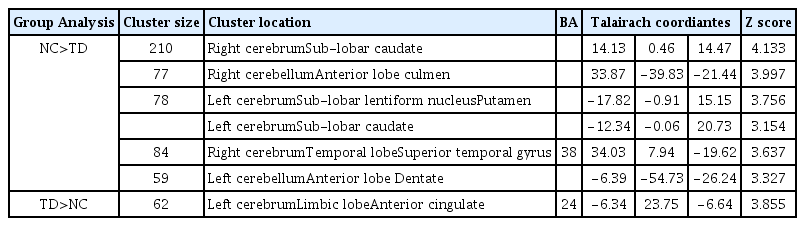
Comparison of QSM Values between Normal Control and Tremor Dominant Group

Comparison of QSM Values between PIGD and Tremor Dominant Group
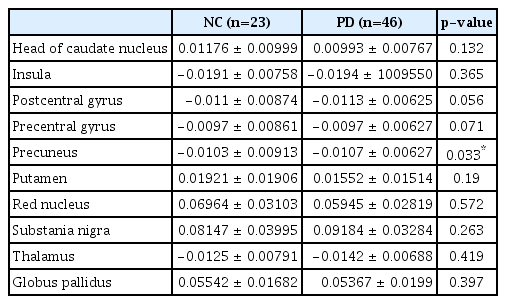
Comparison of QSM Values between Normal Control and PD Group
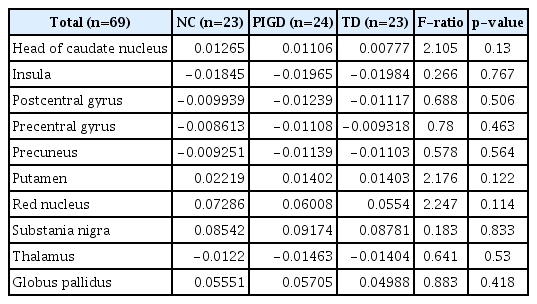
Comparison of QSM Values between Normal Control, PIGD, and Tremor Dominant Group