The Study on Antioxidant and Anti-inflammatory Effects of Taraxacum platycarpum H. Dahlstedt, Lonicera japonica Thunberg and Leonurus japonicus Houtt. Complex
Article information

Abstract
Objectives
This study was designed to experiment with the antioxidant and anti-inflammatory effects of Taraxacum platycarpum H. Dahlstedt, Lonicera japonica Thunberg, and Leonurus japonicus Houtt. complex (TLL) in LPS-induced RAW264.7 cell.
Methods
The antioxidant activity of TLL was measured by FRAP assay, DPPH radical scavenging activity, ABTS radical scavenging activity. Total polyphenol and flavonoid contents of TLL were measured by using standard methods. The anti-inflammatory effects of TLL were measured by NO production, biomarker production (PGE2, IL-1 β, IL-6, TNF-α), mRNA expression level (iNOS, COX-2, IL-1β, IL-6, TNF-α) and protein expression level (ERK, JNK, p38).
Results
Total polyphenol and flavonoid contents in TLL were 58.03±1.02 mg of Gallic acid equivalents (GAE)/g and 16.58±0.60 mg of Quercetin equivalents (QE)/g respectively. In FRAP assay, DPPH and ABTS radical scavenging activity, a concentration-dependent increase in TLL was observed. To explore antioxidant and anti-inflammatory effects of TLL, RAW 264.7 cells were treated with TLL and LPS for 24 hours. Cell viability of RAW 264.7 cells were measured by adding EZ-Cytox, It was remarkably increased at 50, 100, 200 μg/ml concentrations of TLL. NO, ROS, iNOS, IL-1β, IL-6, TNF-α, ERK, JNK and p38 were remarkably decreased at 50, 100, 200 μg/ml concentrations of TLL compared to the control group. PGE2 and COX-2 were remarkably decreased at 100, 200 μg/ml concentrations
Conclusion
These results suggest that TLL complex has antioxidant and anti-inflammatory effects.


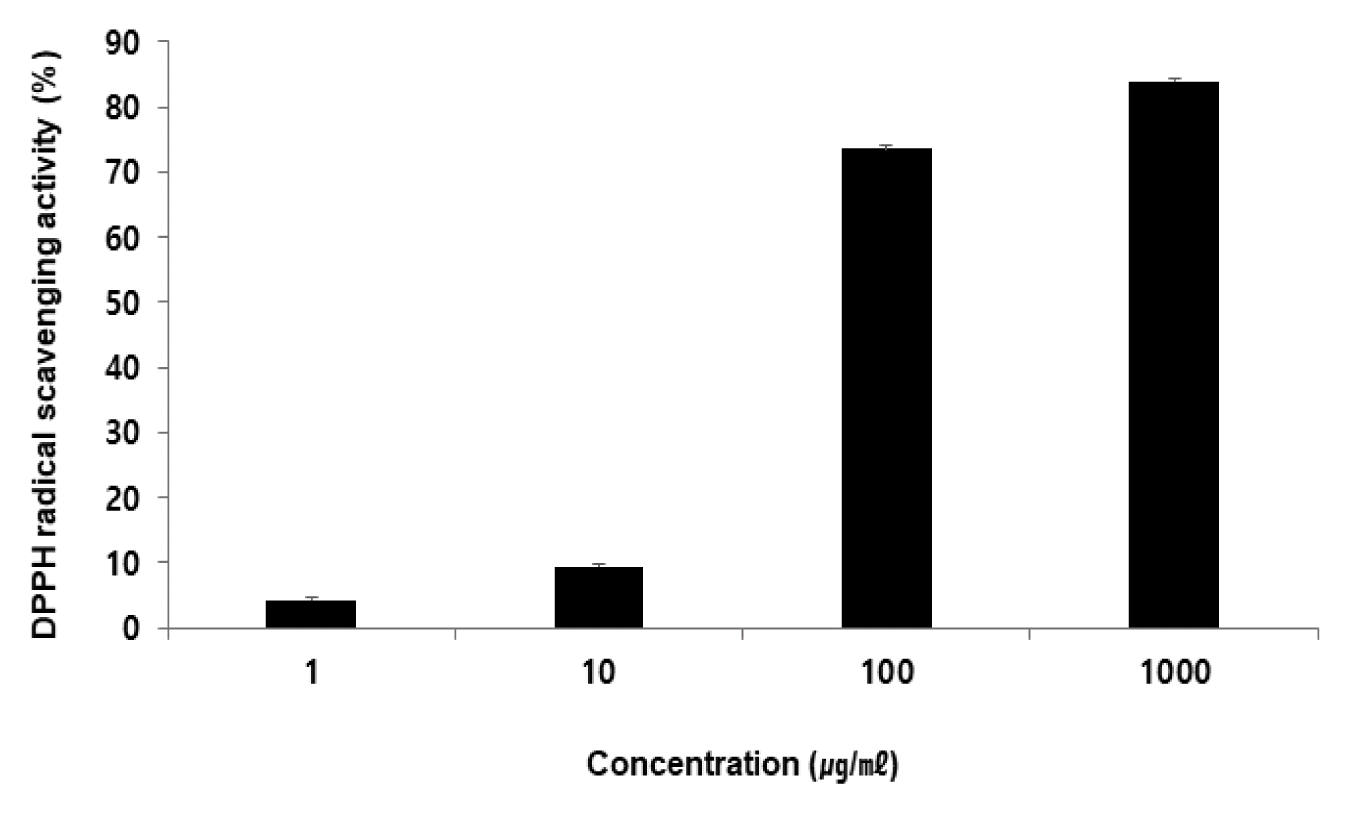
DPPH Radical Scavenging Activity of TLL
Each concentration (1, 10, 100, and 1000 μg/ml) of TLL was incubated with DPPH solution for 30 min. Activities were determined by measuring absorbance at 517 nm. The results were provided as mean ± SEM (n=3)
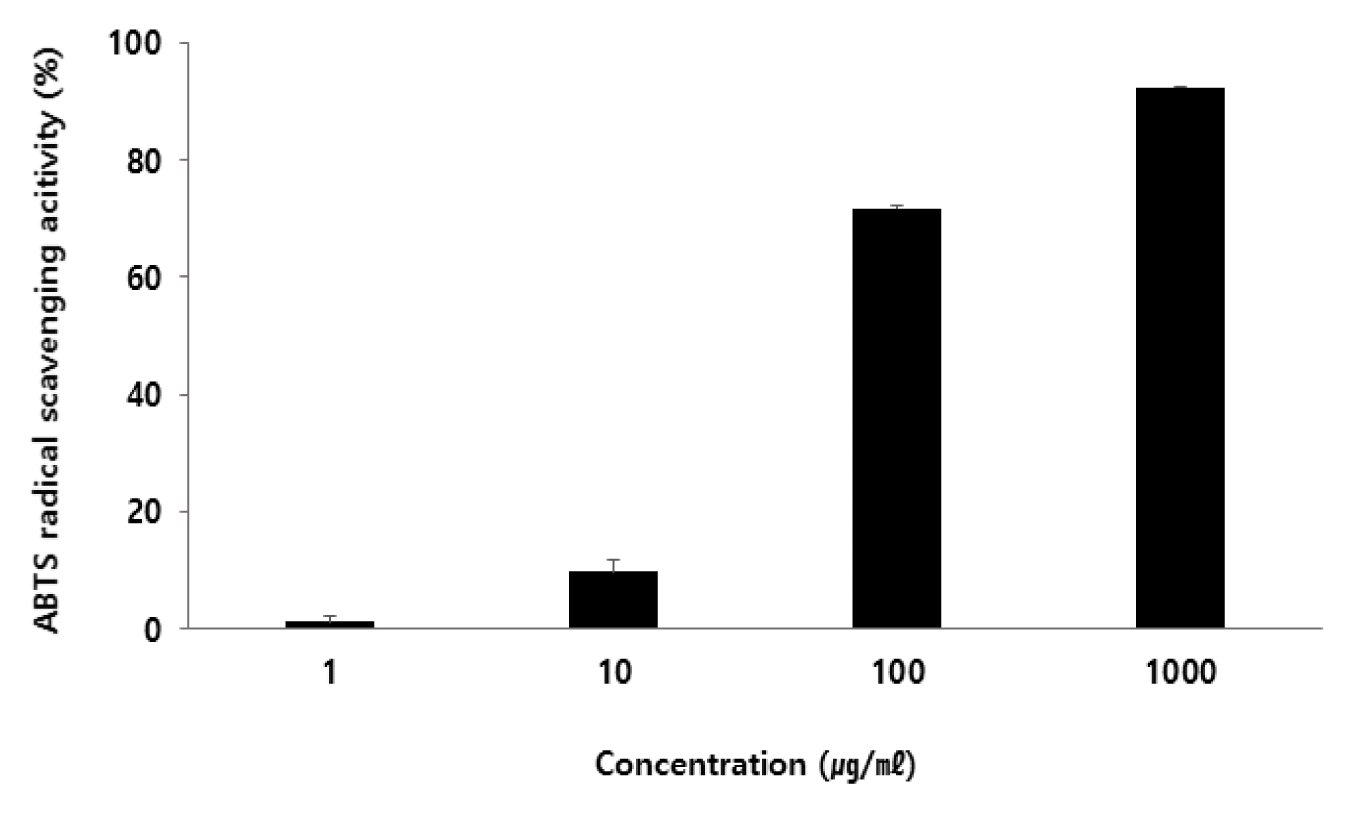
ABTS Radical Scavenging Activity of TLL
Each concentration (1, 10, 100, and 1000 μg/ml) of TLL was incubated with ABTS solution for 10 min. Activities were determined by measuring absorbance at 732 nm. The results were provided as mean ± SEM (n=3)
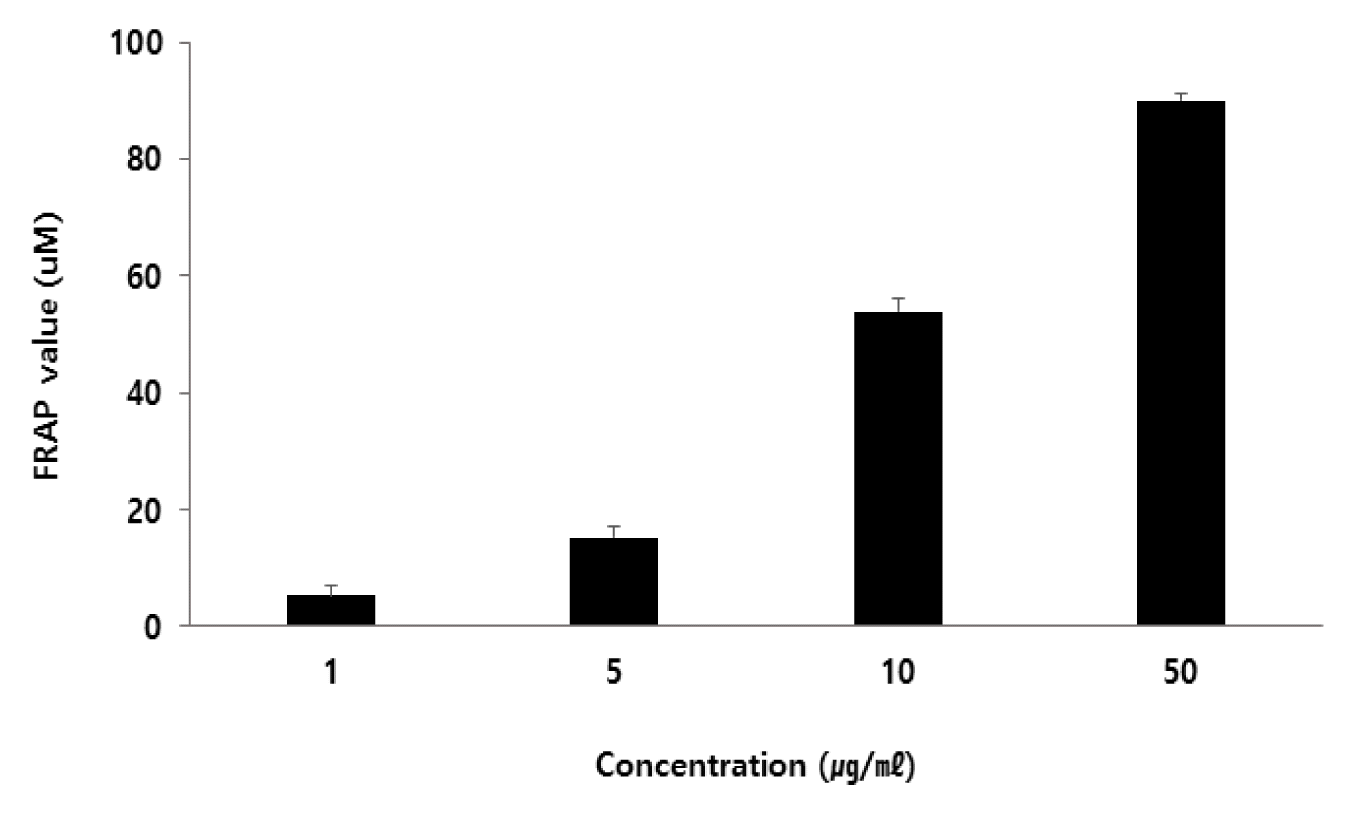
FRAP Value of TLL.
Each concentration (1, 5, 10, and 50 μg/ml) of TLL was incubated with FRAP regent solution for 30 min. Activities were determined by measuring absorbance at 593 nm. The results were provided as mean ± SEM (n=3)
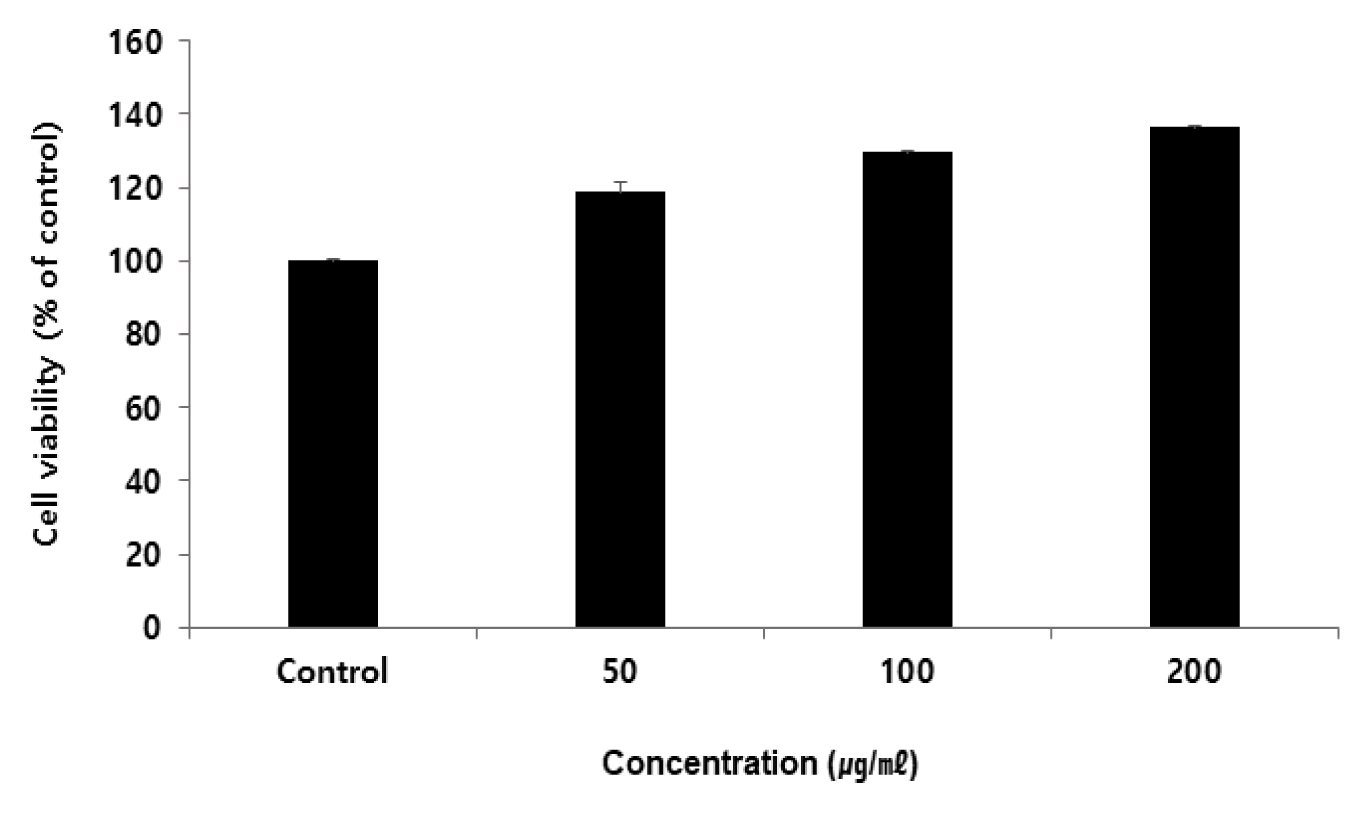
Cell viability of TLL in RAW264.7 cell.
RAW264.7 cells were treated by each concentration (50, 100, and 200 μg/ml) of TLL for 24 h. EZ-Cytox was added to treated cells and reacted for 30 min, thereafter microplate reader was used for measuring absorbance of the solution at 450 nm. Cell viability was calculated as percentage with regard to the control. The results were provided as mean ± SEM (n=3)
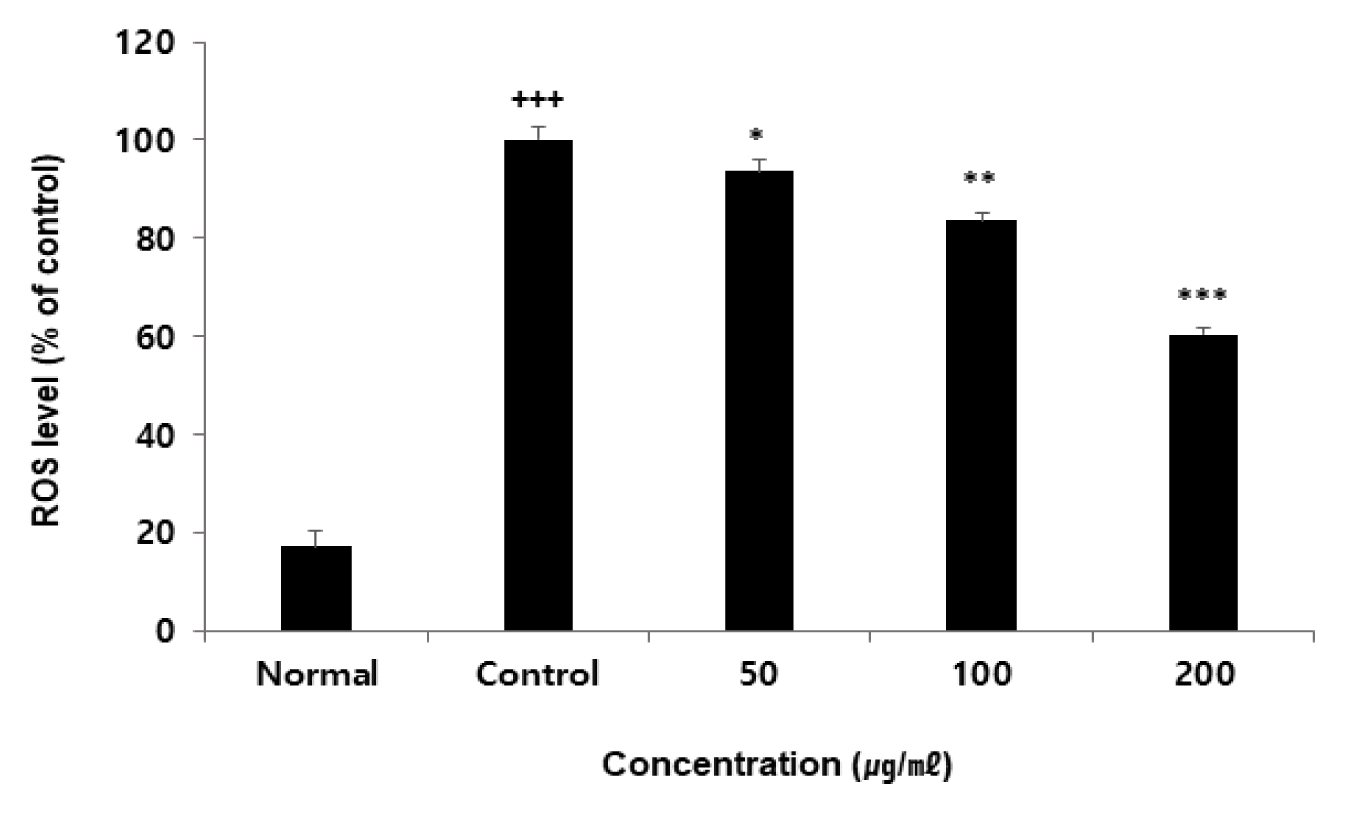
Effect of TLL on ROS level in RAW264.7 cell
RAW264.7 cells were treated by each concentration (50, 100 and 200 μg/ml) of TLL with 100 ng/ml LPS for 24 h. ROS levels were calculated as percentage with regard to the control. The results were provided as mean ± SEM (n=3) (Significance of results, +++: p<0.001 compared to normal, *: p<0.05, **: p<0.01, ***: p <0.001 compared to control).
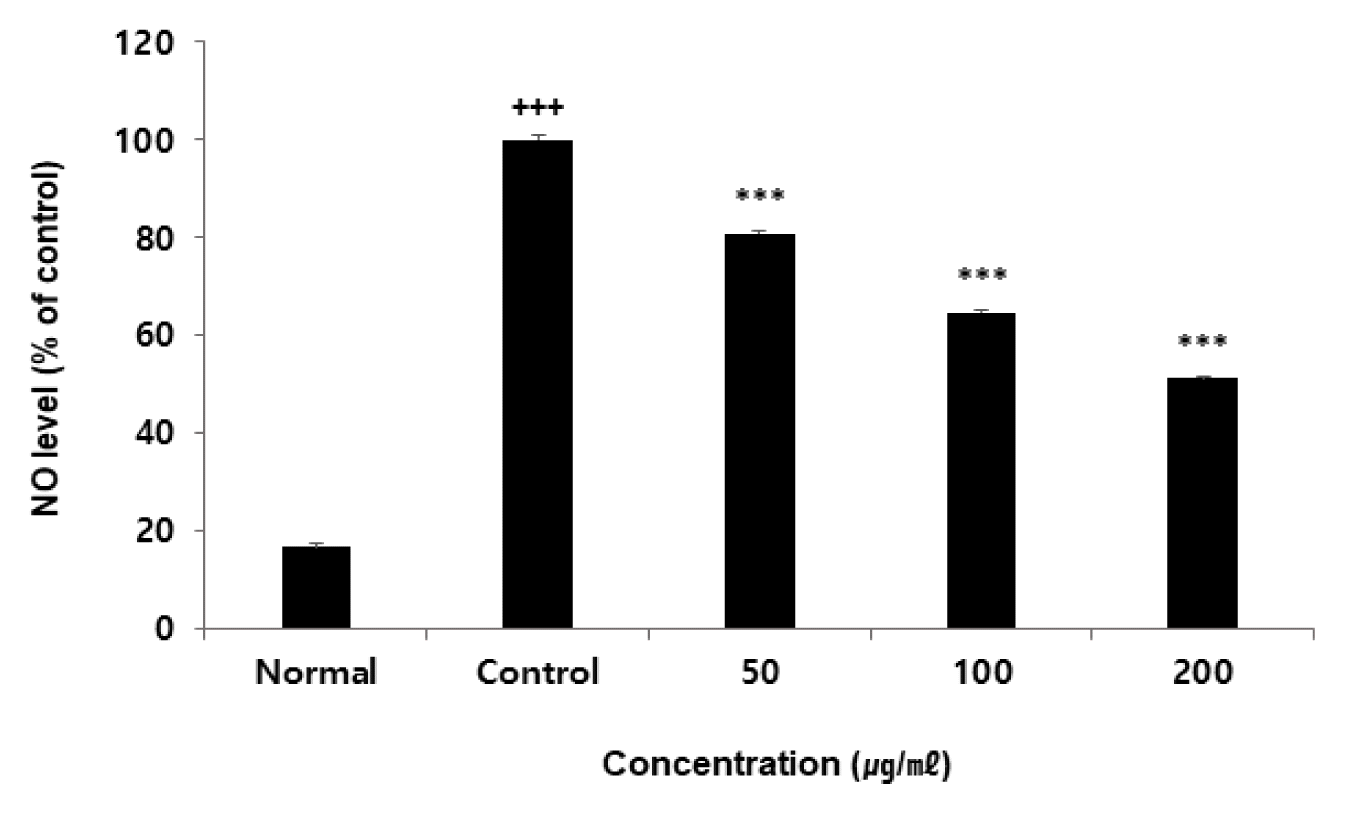
Effect of TLL on NO level in RAW264.7 cell
RAW264.7 cells were treated by each concentration (50, 100 and 200 μg/ml) of TLL with 100 ng/ml LPS for 24 h. NO levels were calculated as percentage with regard to the control. The results were provided as mean ± SEM (n=3) (Significance of results, +++: p<0.001 compared to normal, ***: p<0.001 compared to control).
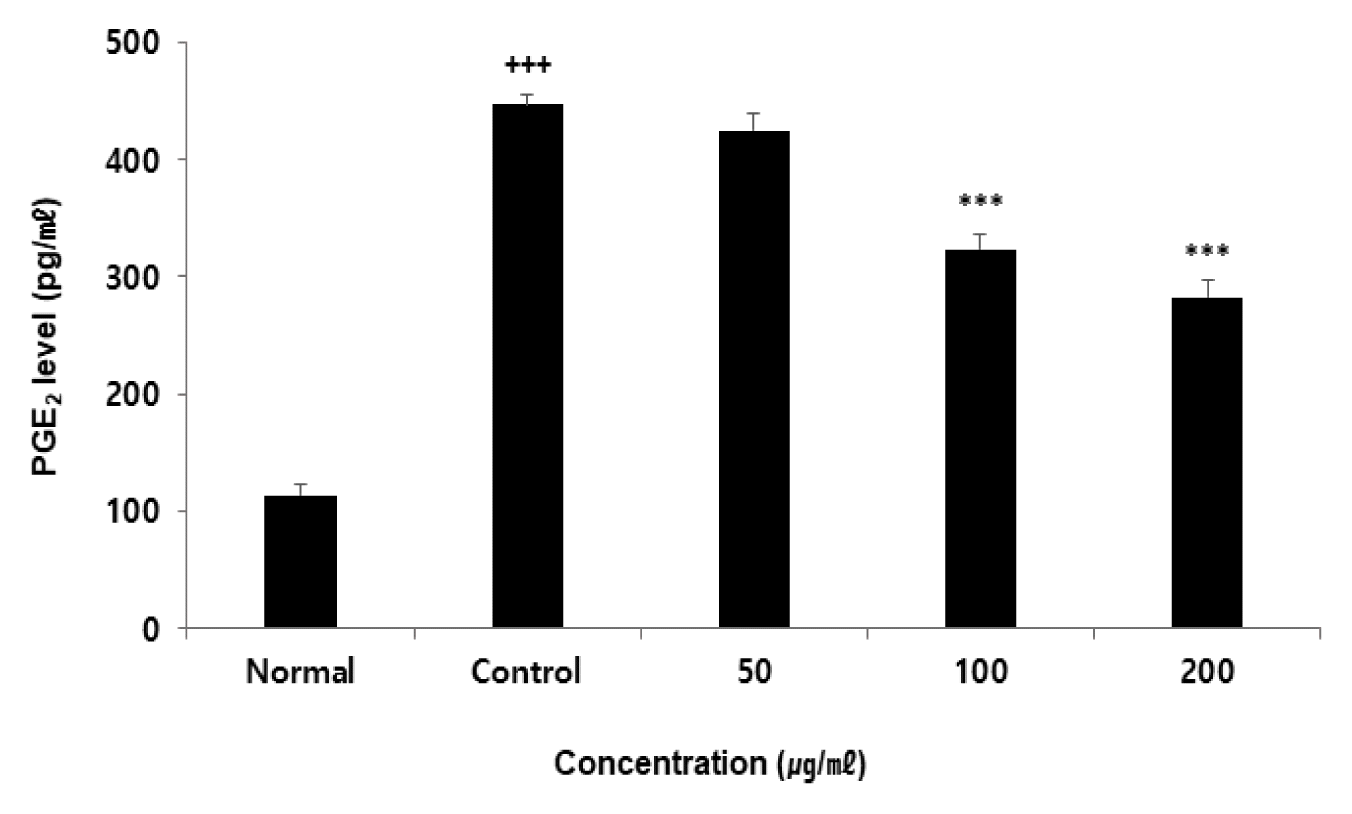
Effect of TLL on PGE2 level in RAW264.7 cell
RAW264.7 cells were treated by each concentration (50, 100, and 200 μg/ml) of TLL with 100 ng/ml LPS for 24 h. Treated cells were measured by mouse PGE2 ELISA kit. The results were provided as mean ± SEM (n=3) (Significance of results, +++: p<0.001 compared to normal, ***: p<0.001 compared to control).
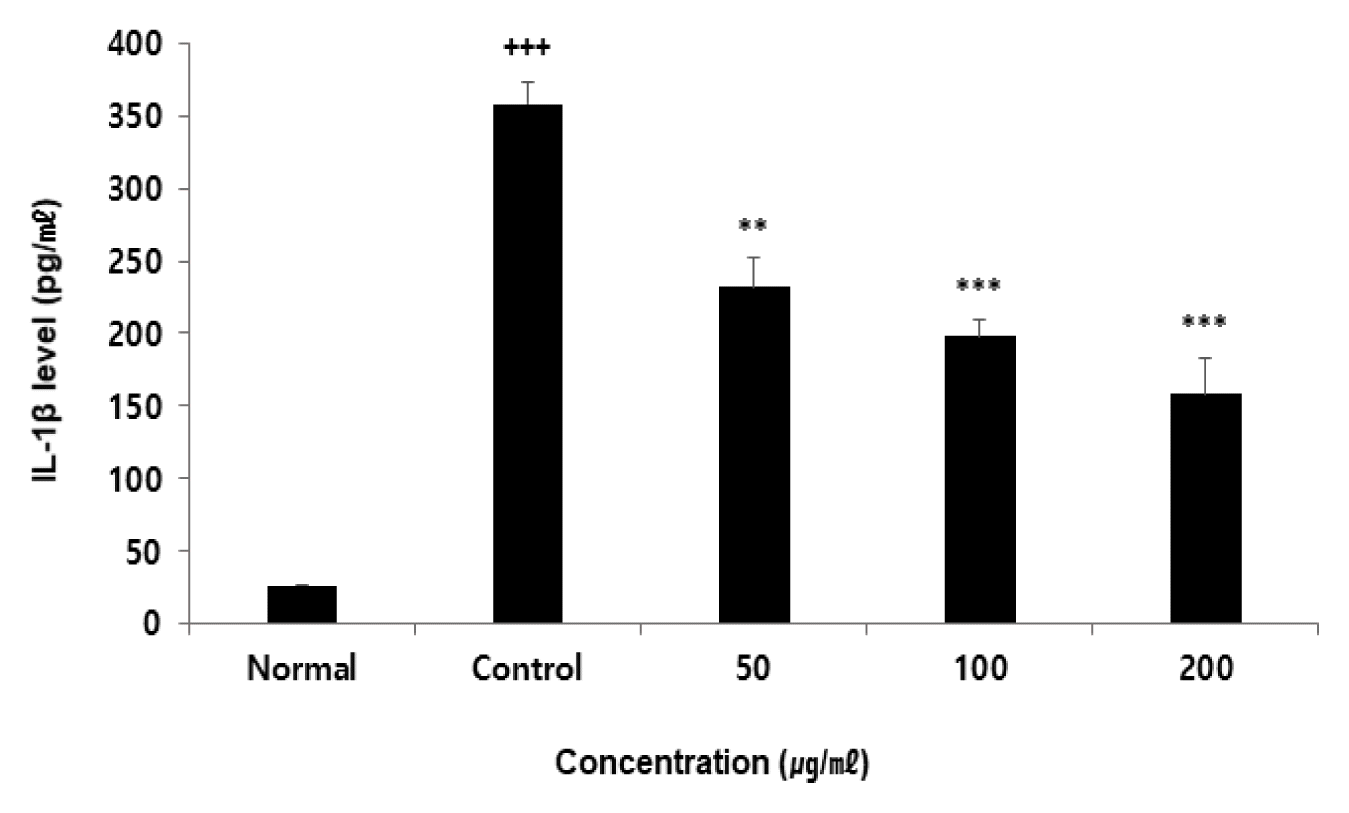
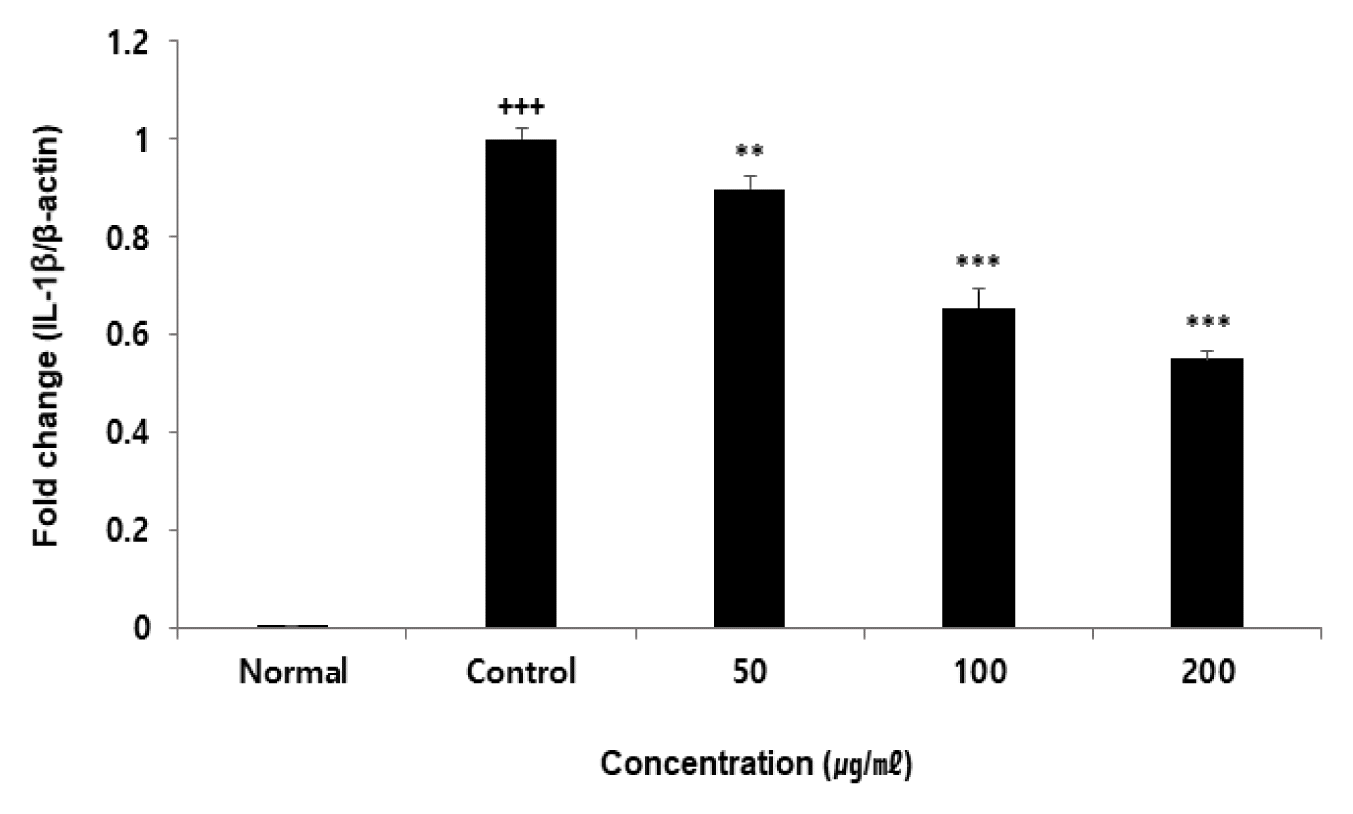
Effect of TLL on IL-1β level in RAW264.7 cell
RAW264.7 cells were treated by each concentration (50, 100, and 200 μg/ml) of TLL with 100 ng/ml LPS for 24 h. Treated cells were measured by mouse IL-1beta ELISA kit. The results were provided as mean ± SEM (n=3) (Significance of results, +++: p<0.001 compared to normal, **: p<0.01, ***: p<0.001 compared to control).
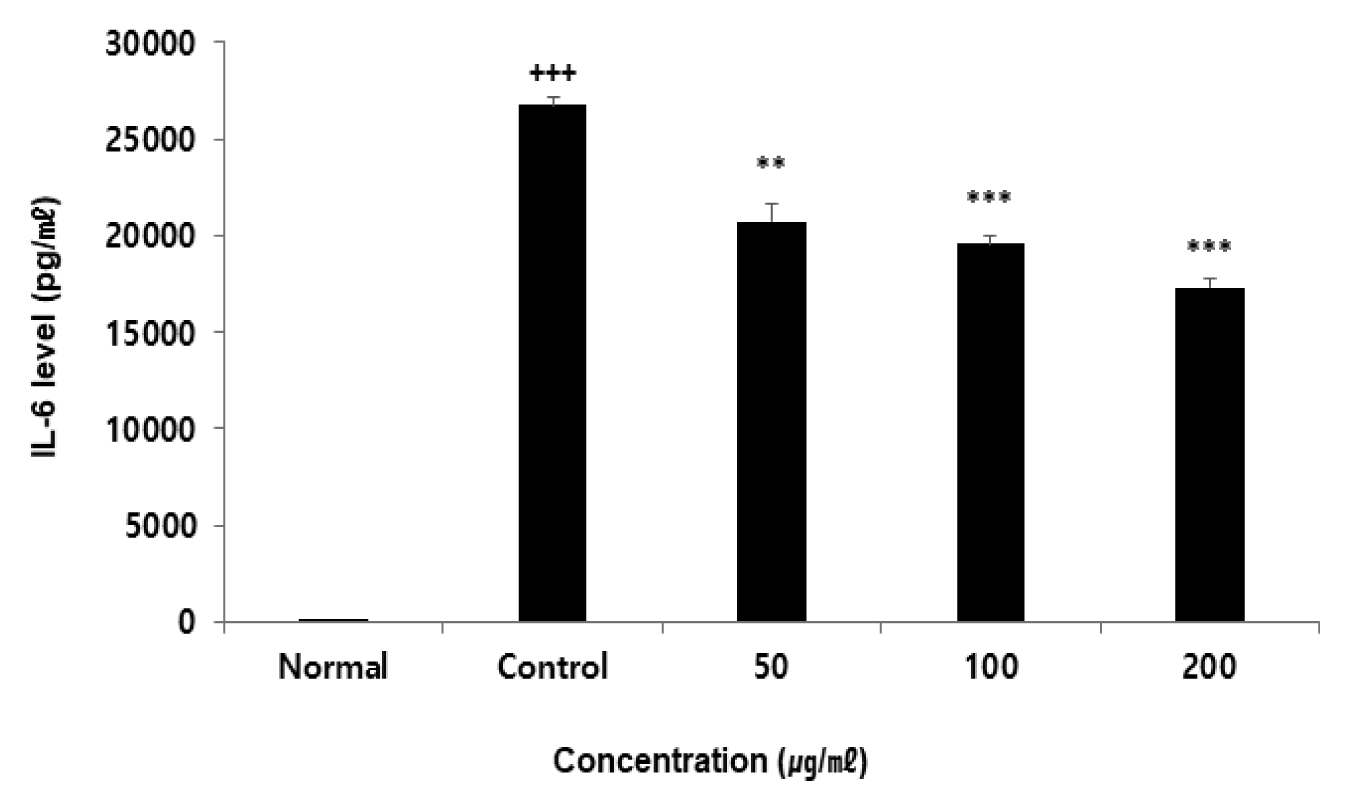
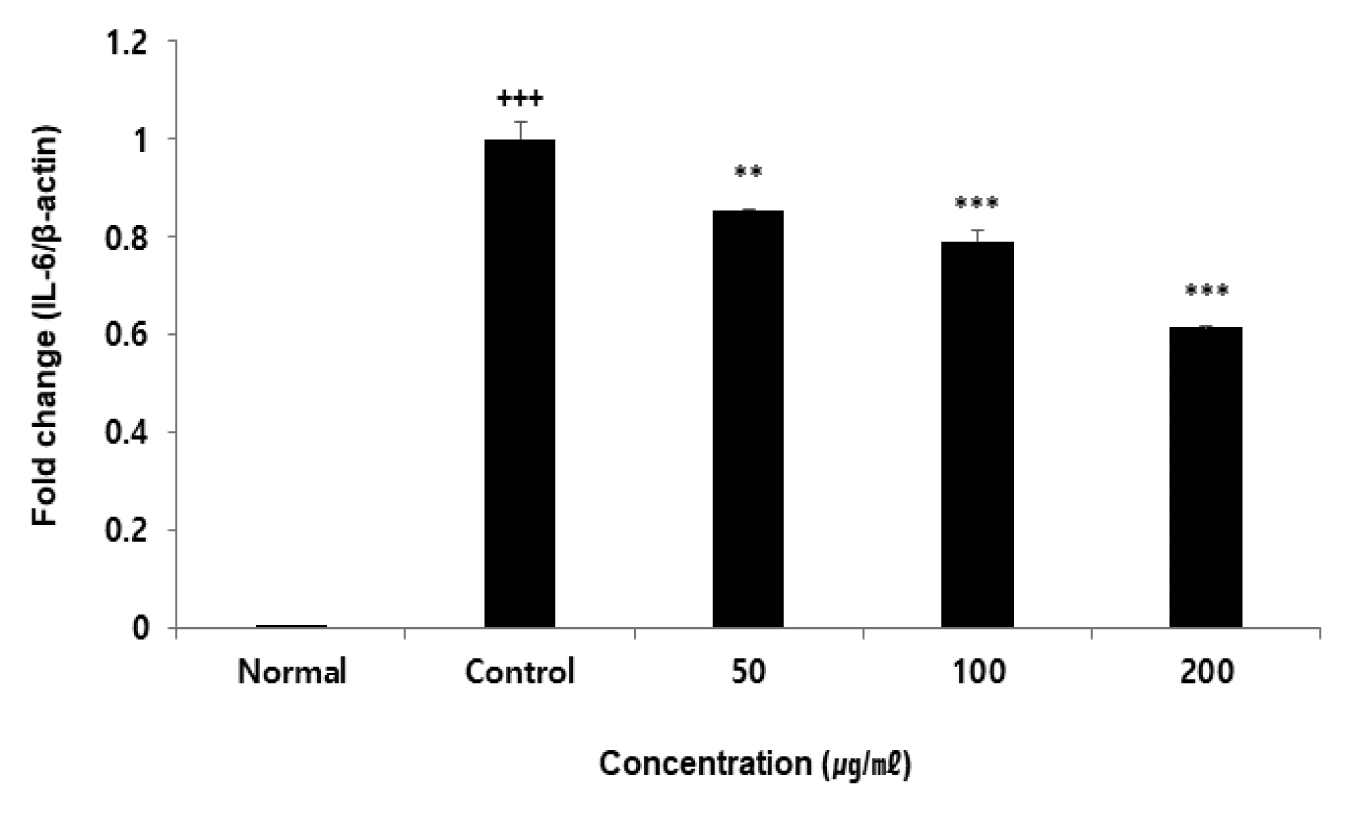
Effect of TLL on IL-6 level in RAW264.7 cell
RAW264.7 cells were treated by each concentration (50, 100, and 200 μg/ml) of TLL with 100 ng/ml LPS for 24 h. Treated cells were measured by mouse IL-6 ELISA kit. The results were provided as mean ± SEM (n=3) (Significance of results, +++: p<0.001 compared to normal, **: p<0.01, ***: p<0.001 compared to control).
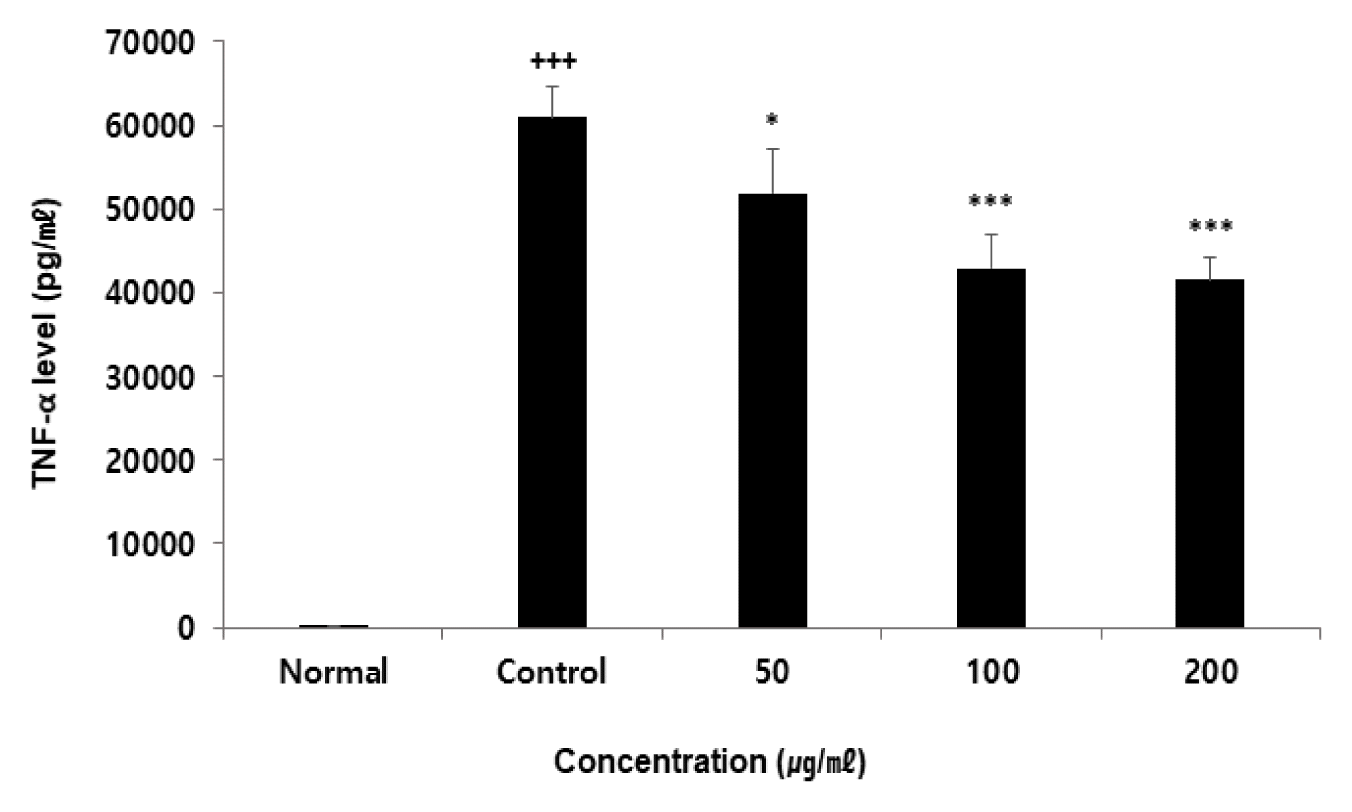
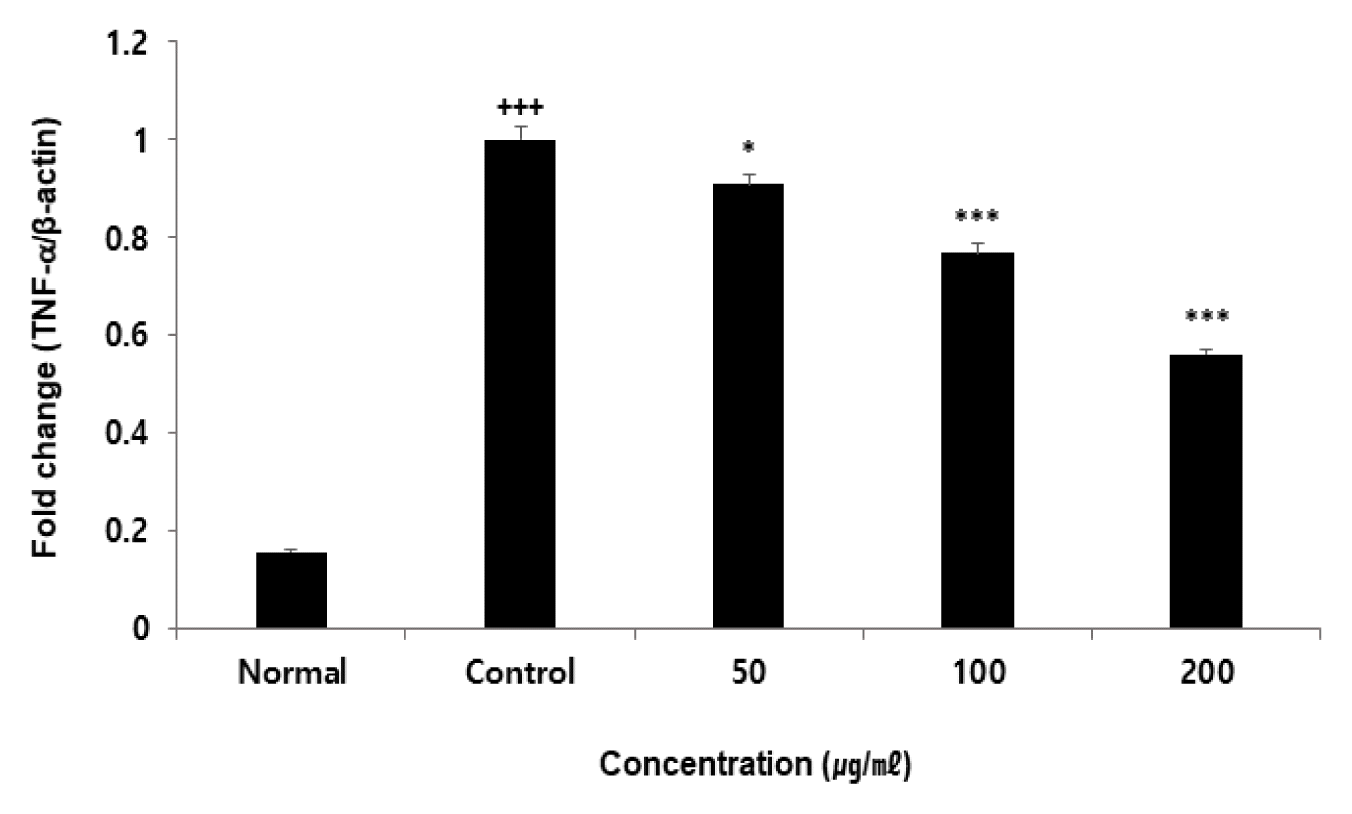
Effect of TLL on TNF-α level in RAW264.7 cell
RAW264.7 cells were treated by each concentration (50, 100, and 200 μg/ml) of TLL with 100 ng/ml LPS for 24 h. Treated cells were measured by mouse TNF-α ELISA kit. The results were provided as mean ± SEM (n=3) (Significance of results, +++: p<0.001 compared to normal, *: p<0.05, ***: p<0.001 compared to control).
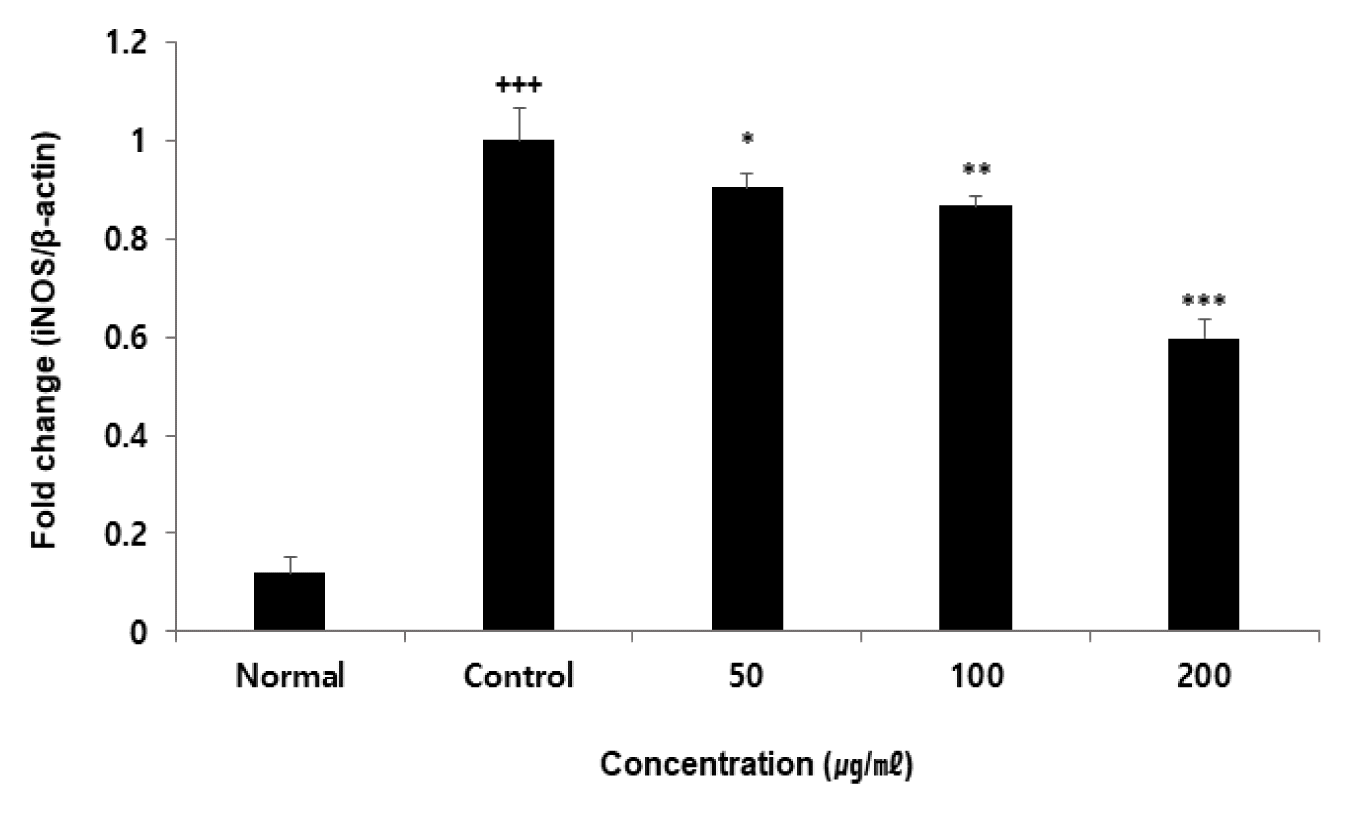
Effect of TLL on iNOS mRNA expression level in RAW264.7 cell
RAW264.7 cells were treated by each concentration (50, 100, and 200 μg/ml of TLL with 100 ng/ml) LPS for 24 h. The mRNA levels of iNOS expression were measured by polymerase chain reaction. The normal group was not treated LPS. The results were provided as mean ± SEM (n=3) (Significance of results, +++: p<0.001 compared to normal, *: p<0.05, **: p<0.01, ***: p<0.001 compared to control).
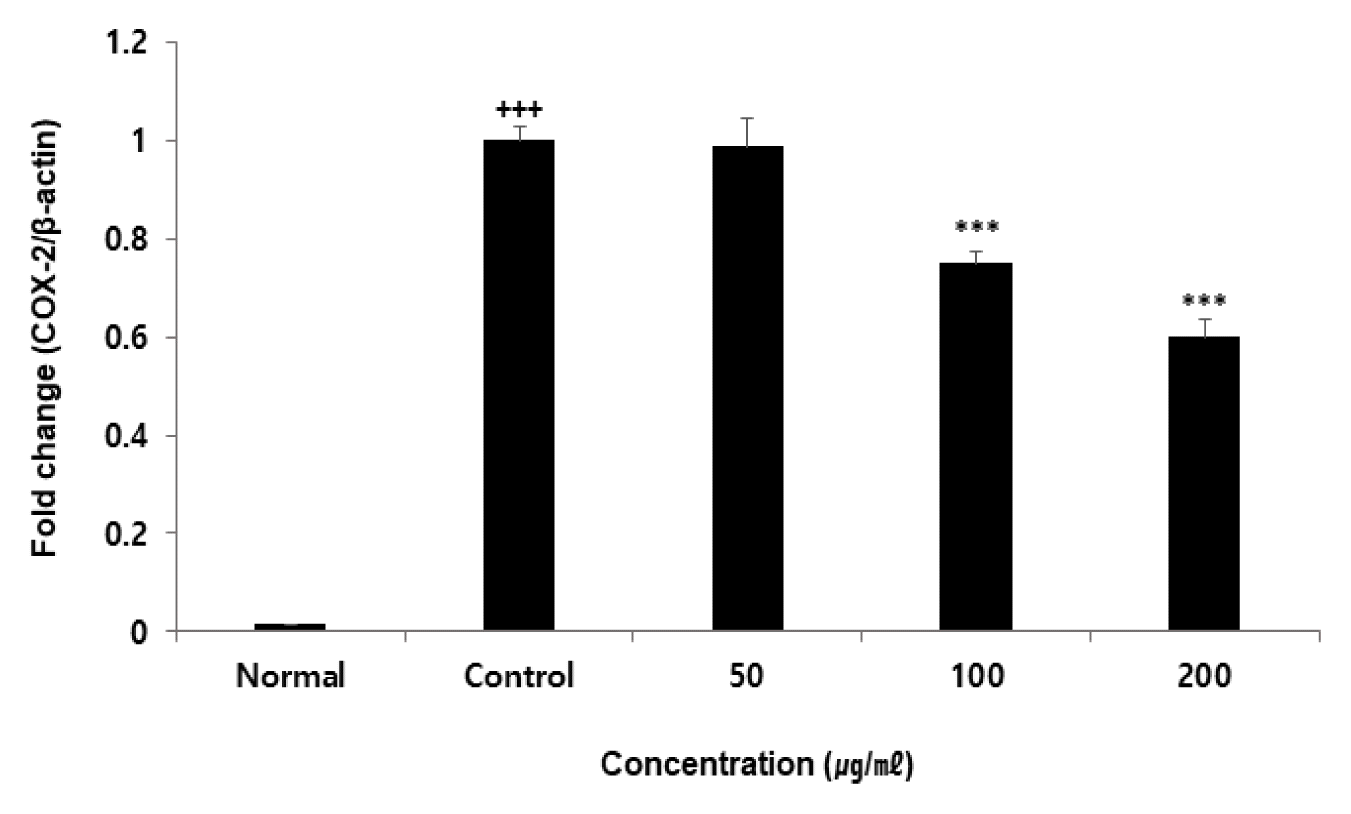
Effect of TLL on COX-2 mRNA expression level in RAW264.7 cell
RAW264.7 cells were treated by each concentration (50, 100, and 200 μg/ml) of TLL with 100 ng/ml LPS for 24 h. The mRNA levels of COX-2 expression were measured by polymerase chain reaction. The normal group was not treated LPS. The results were provided as mean ± SEM (n=3) (Significance of results, +++: p<0.001 compared to normal, ***: p<0.001 compared to control).
Effect of TLL on IL-1β mRNA expression level in RAW264.7 cell
RAW264.7 cells were treated by each concentration (50, 100, and 200 μg/ml) of TLL with 100 ng/ml LPS for 24 h. The mRNA levels of IL-1β expression were measured by polymerase chain reaction. The normal group was not treated LPS. The results were provided as mean ± SEM (n=3) (Significance of results, +++: p<0.001 compared to normal, **: p<0.01, ***: p<0.001 compared to control).
Effect of TLL on IL-6 mRNA expression level in RAW264.7 cell
RAW264.7 cells were treated by each concentration (50, 100, and 200 μg/ml) of TLL with 100 ng/ml LPS for 24 h. The mRNA levels of IL-6 expression were measured by polymerase chain reaction. The normal group was not treated LPS. The results were provided as mean ± SEM (n=3) (Significance of results, +++: p<0.001 compared to normal, **: p<0.01, ***: p<0.001 compared to control).
Effect of TLL on TNF-α mRNA expression level in RAW264.7 cell
RAW264.7 cells were treated by each concentration (50, 100, and 200 μg/ml) of TLL with 100 ng/ml LPS for 24 h. The mRNA levels of TNF-α expression were measured by polymerase chain reaction. The normal group was not treated LPS. The results were provided as mean ± SEM (n=3) (Significance of results, +++: p <0.001 compared to normal, *: p<0.05, ***: p<0.001 compared to control).
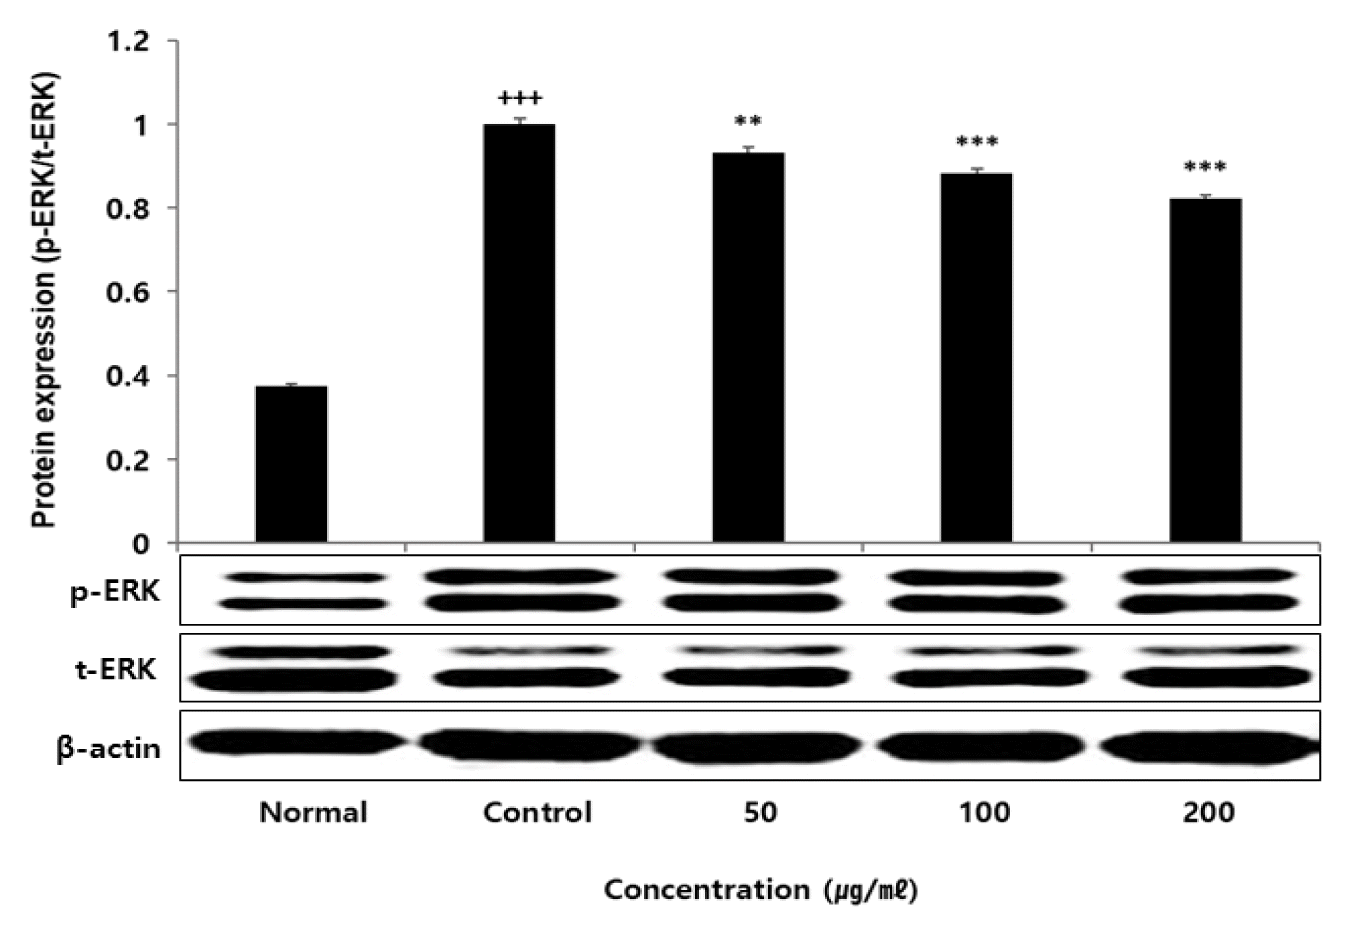
Effect of TLL on ERK protein expression level in RAW264.7 cell
RAW264.7 cells were treated by each concentration (50, 100, and 200 μg/ml) of TLL with 100 ng/ml LPS for 24 h. The total cell extracts were subjected to western blot and 10% SDS-PAGE analysis with the respective primary and secondary antibodies. The results were provided as mean ± SEM (n=3) (Significance of results, +++: p<0.001 compared to normal, **: p<0.01, ***: p <0.001 compared to control).
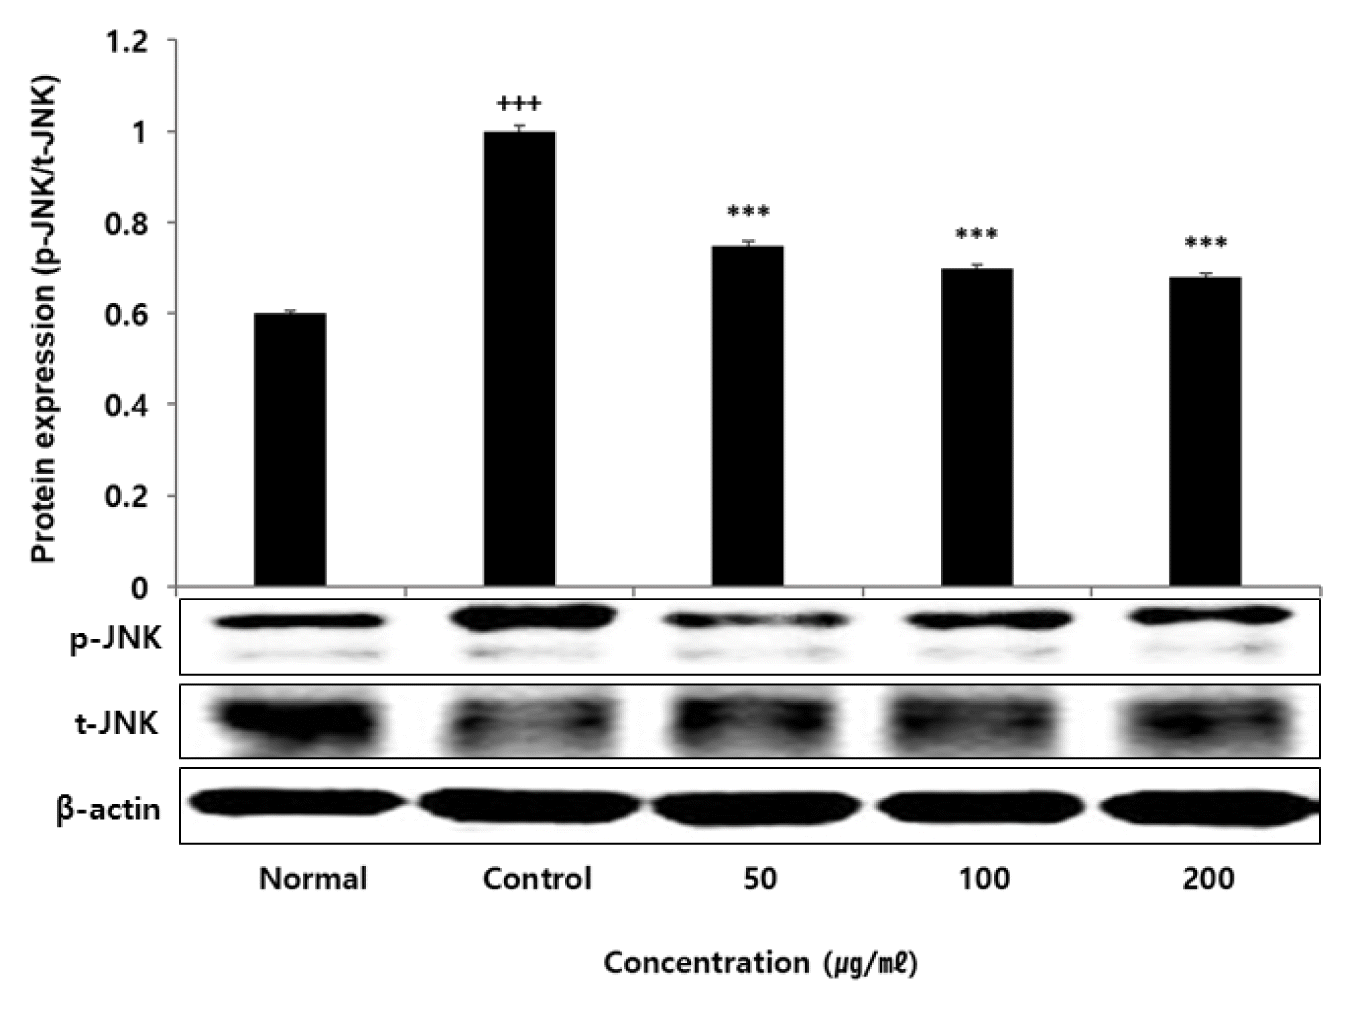
Effect of TLL on JNK protein expression level in RAW264.7 cell
RAW264.7 cells were treated by each concentration (50, 100, and 200 μg/ml) of TLL with 100 ng/ml LPS for 24 h. The total cell extracts were subjected to western blot and 10% SDS-PAGE analysis with the respective primary and secondary antibodies. The results were provided as mean ± SEM (n=3) (Significance of results, +++: p<0.001 compared to normal, ***: p<0.001 compared to control).
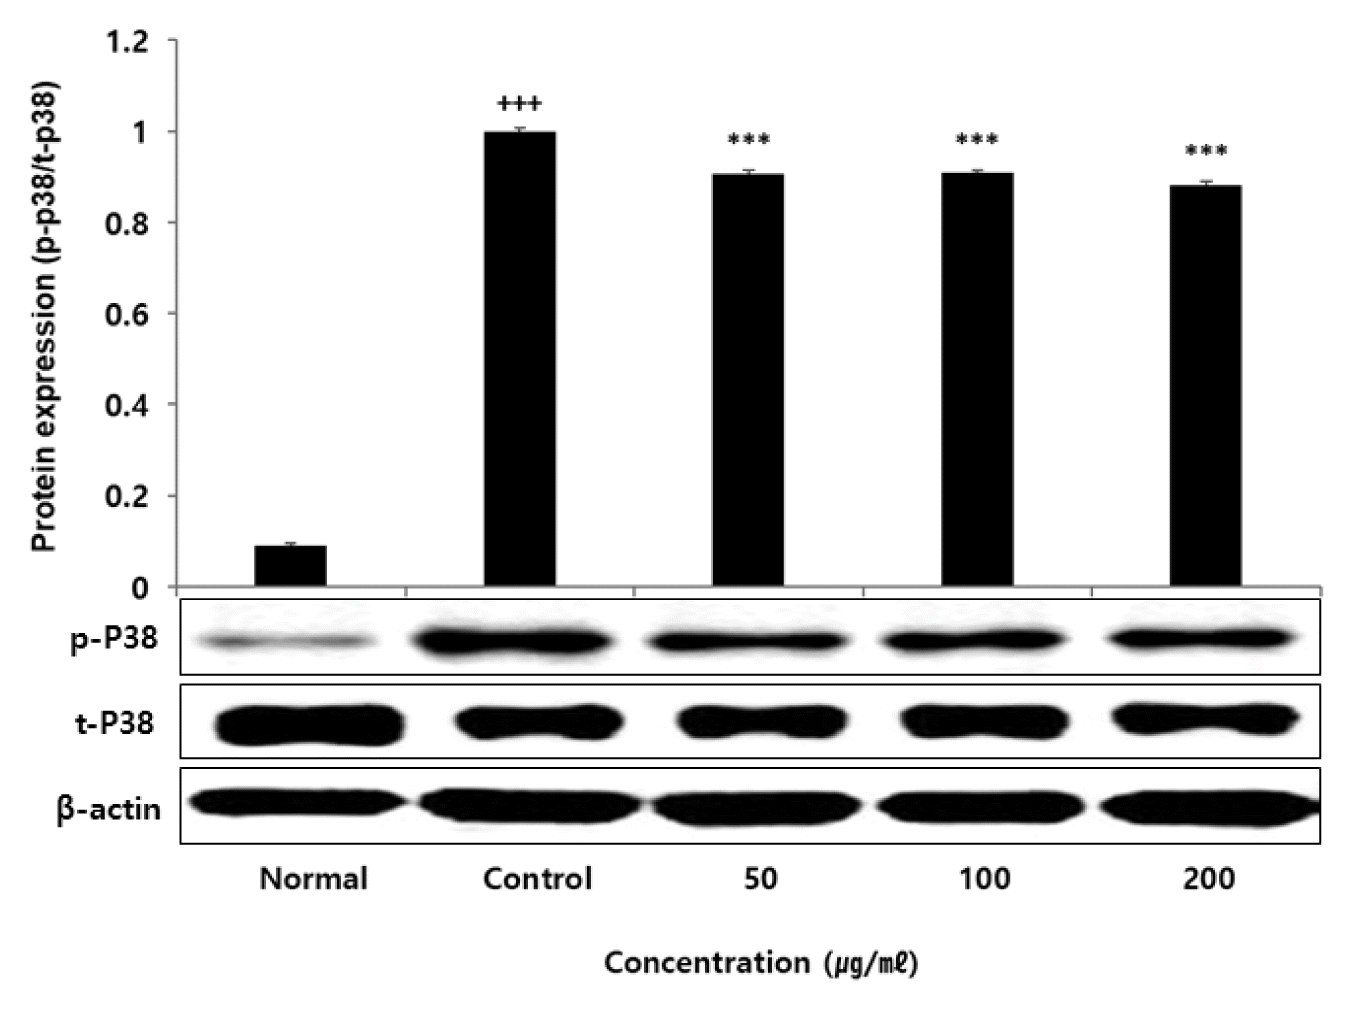
Effect of TLL on p38 protein expression level in RAW264.7 cell
RAW264.7 cells were treated by each concentration (50, 100, and 200 μg/ml) of TLL with 100 ng/ml LPS for 24 h. The total cell extracts were subjected to western blot and 10% SDS-PAGE analysis with the respective primary and secondary antibodies. The results were provided as mean ± SEM (n=3) (Significance of results, +++: p<0.001 compared to normal, ***: p<0.001 compared to control).
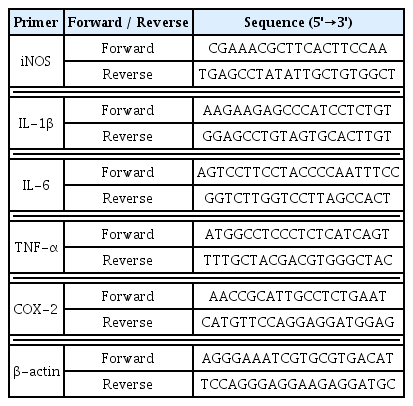
The Sequence of Primers in Real-Time PCR