Statistical Analysis of Outpatients Trends at Korean Medicine Hospitals of Daejeon University by Region before and after COVID-19
Article information

Abstract
Objectives
This study is designed to statistically analyze data of outpatients visiting for recent 3 years. The purpose is to identify tendencies of patients who visit the hospitals before and after COVID-19.
Methods
This study retrospectively analyzed the medical records of 452,487 patients who visited to the Daejeon·Cheonan·Cheongju Korean Medicine Hospital of Daejeon University from January 1, 2018 to August 31, 2020. The data is classified according to year, month, gender, age, and visit type. The statistical analysis was performed using IBM SPSS 25.0.
Results
The total number of patients decreased in 2020 compared to before 2020, and the number of patients in each hospital also decreased from the previous year. According to the year of each hospital, the difference by year was not statistically significant at Daejeon Hospital, but Cheonan and Cheongju Hospital showed statistical difference. The change in monthly according to the year by hospital has continued to decrease from January to March in 2020, unlike the previous year, which recovered from a decline in March. In the analysis of patients by age, there was no statistically significant difference in the number of patients in the above 60s according to the year, while those under 60s have a tendency to significantly decrease..
Conclusion
We expect that the results of this study will be used as reference materials in analyzing effects of COVID-19 at health care utilization.
The change of total number of patients by year
※ Before 2020: Average of 2018 and 2019
The change of number of patients by month
The change of sex ratio by hospital
The change of age ratio by hospital
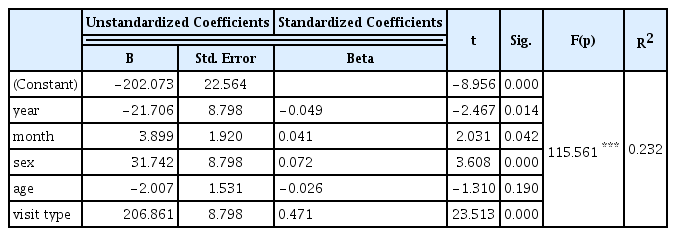
Multiple Linear Regression Analysis of Number of Patients by Year, Month, Sex, Age, and Visit Type
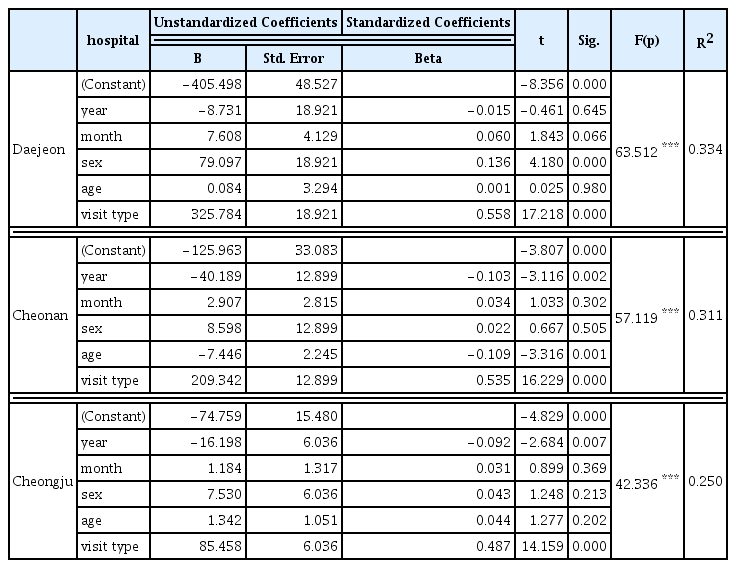
Multiple Linear Regression Analysis of Number of Patients by Year, Month, Sex, Age, and Visit Type according to Hospital
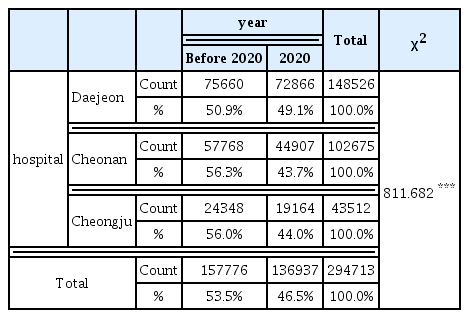
Cross Tabulation of Hospital and Year for Number of Patients
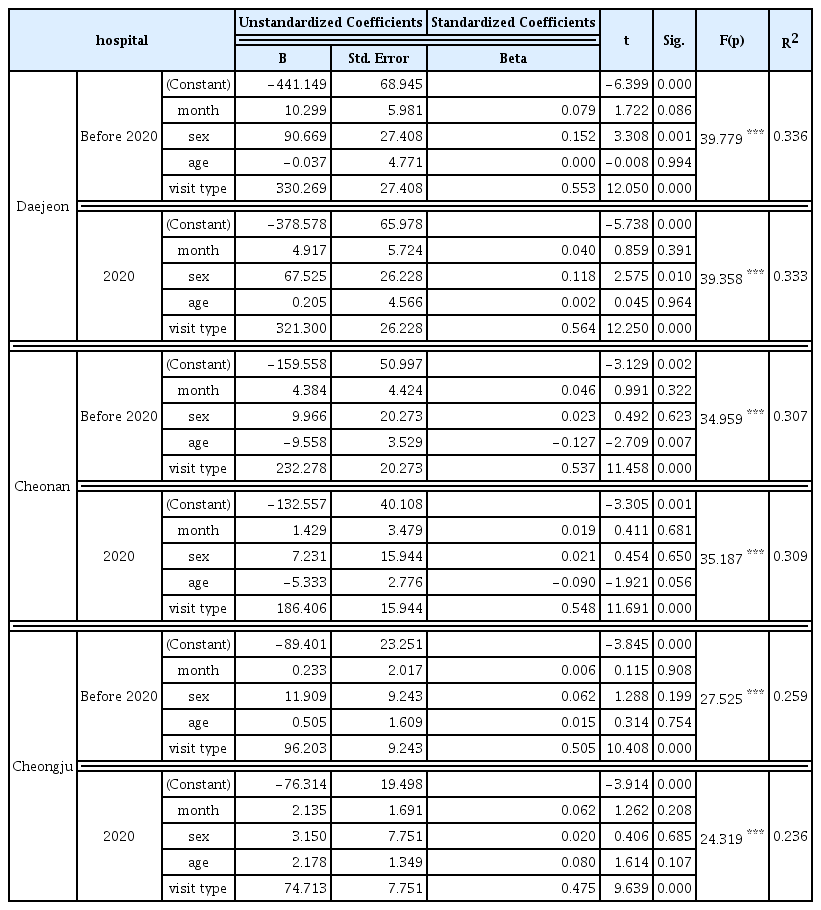
Multiple Linear Regression Analysis of Number of Patients by Month, Sex, Age, and Visit Type according to Hospital and Year
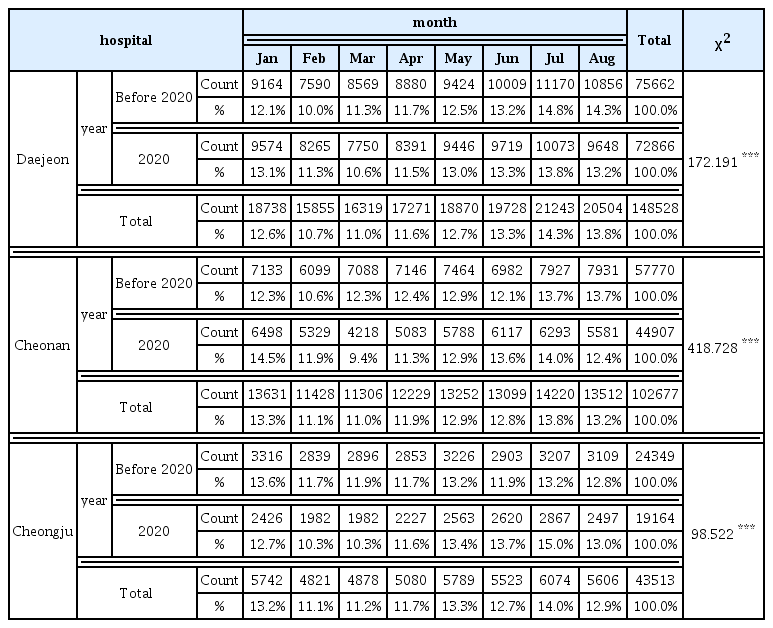
Cross Tabulation of Year and Month for Number of Patients according to Hospital
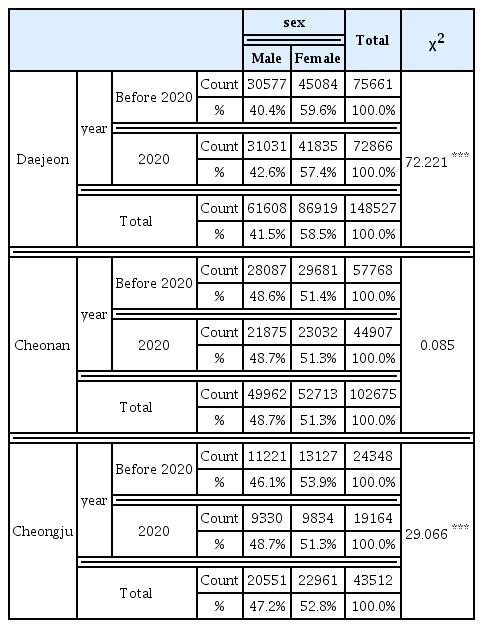
Cross Tabulation of Year and Sex for Number of Patients according to Hospital
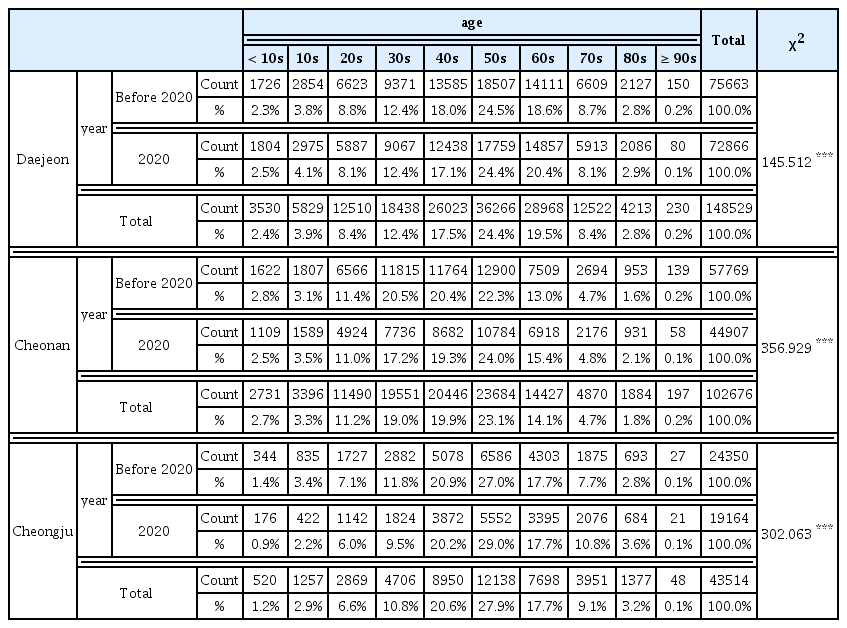
Cross Tabulation of Year and Age for Number of Patients according to Hospital
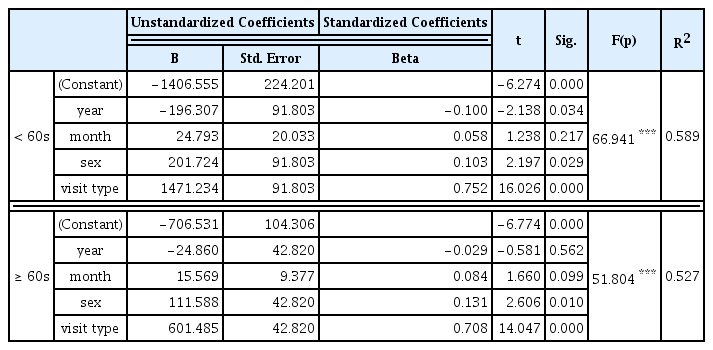
Multiple Linear Regression Analysis of Number of Patients by Year, Month, Sex, and Visit Type in the Two Groups of Under 60s and Above 60s
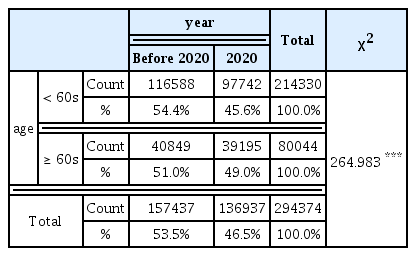
Cross Tabulation of the Two Groups of Under 60s and Above 60s by Year for Number of Patients
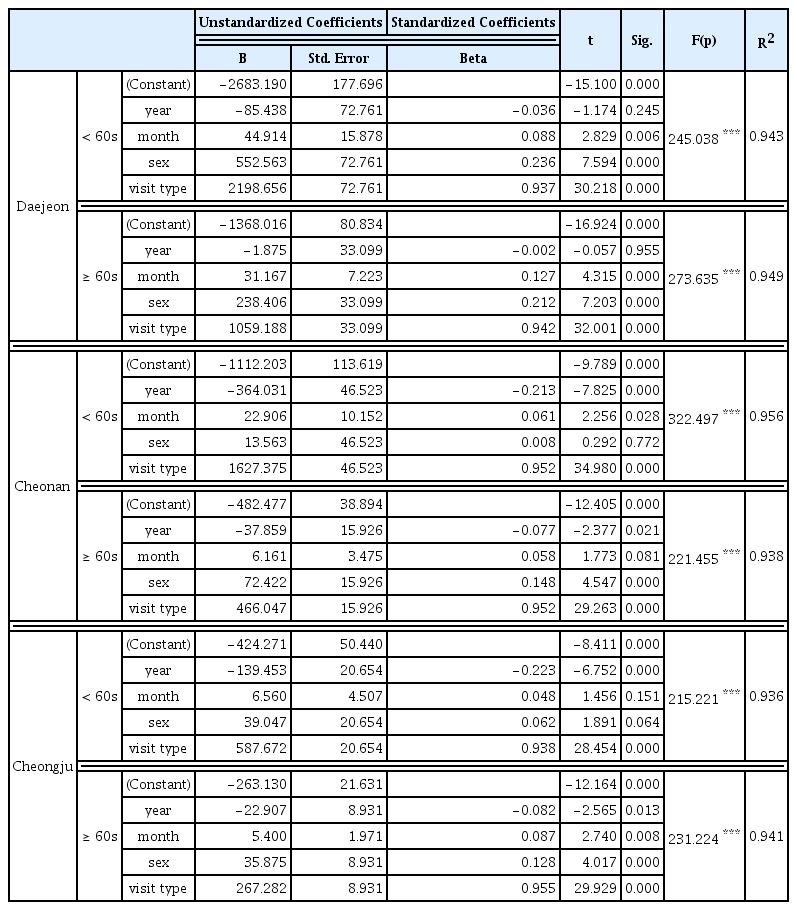
Multiple Linear Regression Analysis of Number of Patients by Year, Month, Sex, and Visit Type by Hospital in the Two Groups of Under 60s and Above 60s
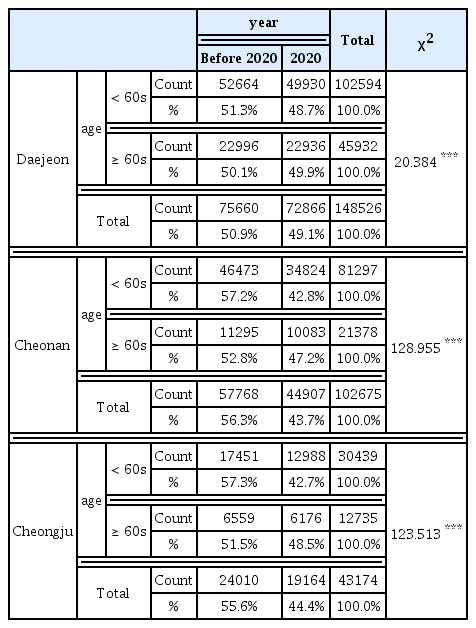
Cross Tabulation of the Two Groups of Under 60s and Above 60s by Year for Number of Patients according to Hospital