An Analysis of the Financial Performance of Korean Medicine Hospitals in Korea: Focusing on Financial Ratios and Investment Efficiency
Article information

Abstract
Objectives
This study investigated the financial performance of Korean Medicine hospitals in Korea in order to understand the current status of hospital management and improve its efficiency.
Methods
Financial statements of 24 medical corporations, 19 juridical foundations and 18 school hospitals from 2016 to 2018 were obtained from the secondary data published by the Health Insurance Review and Assessment Service, the National Tax Service and the Korea Advancing Schools Foundation. Financial performance was measured on 6 dimensions: liquidity, profitability, activity, growth, cost and productivity (investment efficiency) by analyzing 8 financial indicators: Liability to Total Assets, Net Profit to Patient Service Revenues, Total Assets Turnover, Growth Rate of Patient Service Revenues, Operating Expenses to Patient Service Revenues, Value Added to Patient Service Revenues, Value Added to Total Assets, and Value Added to Personnel Expenses.
Results
Korean Medicine hospitals showed lower Liability to Total Assets, Liquidity and Value Added to Total Assets than Western Medicine hospitals did. They also showed higher Value Added to Patient Service Revenues and Value Added to Personnel Expenses than Western Medicine hospitals did. The net profit decreased significantly (−50.8%) in 2018 whereas Patient Service Revenues increased (6.9%) for the same period due to Operating Expenses increase and Non-Operating loss.
Conclusions
These findings suggest that the Korean Medicine hospital sector in Korea needs to improve liquidity and financial structure and to enhance profitability by reducing Personnel Expenses and generating Non-operating revenues in order to improve its investment efficiency and competitiveness.
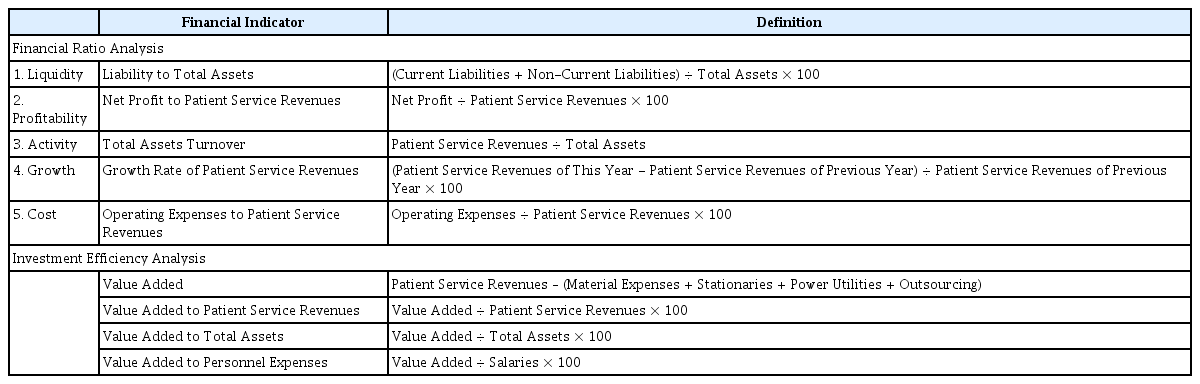
Financial Indicators

Characteristics of Analyzed Korean Medicine Hospitals

Balance Sheet of Korean Medicine Hospitals (per 100 beds, Fiscal Year 2018)
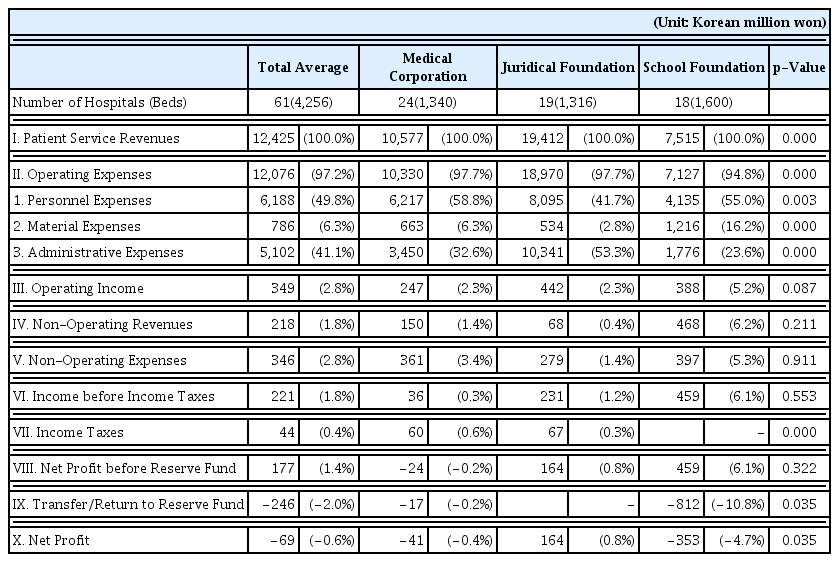
Income Statement of Korean Medicine Hospitals (per 100 beds, Fiscal Year 2018)

Financial Ratio Analysis of Korean Medicine Hospitals (Fiscal Year 2018)
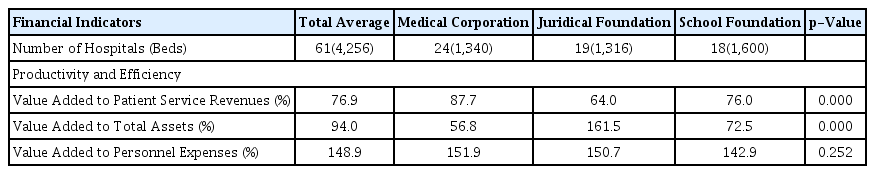
Investment Efficiency Analysis of Korean Medicine Hospitals (Fiscal Year 2018)