Melanin Synthesis Inhibitory Effect of Eriobotryae Folium Extracts & Eriobotryae Folium and Phreatic Water Mixture
Article information
Abstract
Objectives
As interests in the beauty of skin is growing continuously, more people are focusing on white and clean skin. Melanin is the major factor that determines skin color. The abnormal concentration of melanin causes various skin diseases such as vitiligo, freckles, and melasma. This study investigated the inhibitory effect of Eriobotryae Folium extracts (EF) with phreatic water (PW) on the melanin synthesis.
Methods
The effect of EF on melanin synthesis was evaluated by using mouse melanoma cells (B16F10). To define the mechanisms, real-time PCR and western blot were used. We also evaluated the inhibitory effects of EF and PW on melanin synthesis by using HRM-2 melanin-possessing hairless mice. After UVB irradiation, melanin differences between the skin parts that were treated and untreated with EF and PW. Levels of mRNA were measured by real-time quantitative PCR and histological analysis of the dorsal skin was conducted by hematoxylin and eosin staining.
Results
EF inhibited various mechanisms of melanogenesis, and the effect was increased when combined with PW. In vitro experiments have shown that EF inhibited the expressions of tyrosinase related protein-1 (TRP-1) mRNA, tyrosinase mRNA, microphthalmia-associated transcription factor (MITF) mRNA and the tyrosinase inhibitory activation, but it stimulated the extracellular regulated kinase (ERK) mRNA expression. In vivo experiments have shown that EF prevented melanogenesis in the mice dorsal skin and inhibited TRP-1 mRNA expression. Also these effects were increased when combined with PW.
Conclusions
EF and PW might be a new and effective treatment for whitening and treating pigmentation of skin.
Introduction
Recently, ultraviolet exposure to skin is increased due to environmental pollution. So skin aging, pigmentation and wrinkles have become serious problems. Also as the development of society, interest in the beauty of the skin is growing continuously [1,2].
The color of human skin is determined by the amount of melanin, carotene, and hemoglobin. Among them, melanin is the most important factor. If melanin is produced abnormally low, skin lesions such as vitiligo are caused. Conversely, if it is overproduced, it forms the freckles, melasma, and it
Skin pigmentation such as freckles and melasma is also closely associated with skin cancer [3,4]is mainly due to the increase of melanin synthesis by the melanocytes. Therefore, by inhibiting melanin synthesis, it is possible to expect the effect of skin whitening [5].
In recent researches, interests in effective and stable natural extracts that have the skin whitening effect is growing continuously. Numerous researches are focusing particularly on herbal medicine, which efficacy and safety have been proven from long time usage [6].
Eriobotryae Folium (EF) is the dried leaf of loquat tree which belongs to the Rosaceae and it has antioxidant, anti-inflammatory effect. Many experiments are undergoing for the development of functional cosmetics utilizing EF [7]. However, these researches are mostly about remedying wrinkles through antioxidant effects or remedying skin inflammation through anti-inflammatory effects. Researches dealing with the skin whitening effect of EF are in shortage.
Thus, in this research we investigated the whitening effect of EF by inhibiting melanin production. Additionally we proved that the effect increases when EF was used with hot spring water.
Methods
1. Cell strain and cell culture
B16F10 mouse melanoma cells (ATCC, Manassas, VA, USA) were used as cell strain in experiments. The cells were floated on Dulbecco’s modified Eagle medium(DMEM), to which 10% fetal bovine serum (FBS) and 1% penicillin/streptomycin (100 U/ml) were added, and adapted in the 37°C, 5%, CO2 incubator for subculture.
2. Medicines
The Eriobotryae Folium(EF) was purchased from Omniherb (www.omniherb.com), Daegu, Korea. Its place of origin is China.
3. Separation of Eriobotryae Folium (EF) extracts
200g EF powder was digested in 30% ethanol (1.5l) in ASE300 Accelerated Solvent Extractor (DIONEX Co., Sunnyvale, CA, USA) for 3 days, and the liquid was extracted for 20 minutes in 50°C. 18g of extract was obtained by lyophilizing extracted remaining solution that was obtained by decompressing drying extracted solution in cold trap −70°C and chamber temperature 40°C in freezing dryer (Biotron Co., Bucheon, Geonggi, Korea) for 24 hours.
4. Animals
Total 6 (n=6) 20–22g HRM-2 melanin-possessing hairless mice from Hoshino Laboratory Animals Co. Ltd. (Saitama, Japan) were used. They were fed with antibiotic-free pellet feed (Samyang Feed Co., Seoul, Korea) and water. They were adapted in the vivarium for one week that maintains temperature 22±2°C, humidity 55±15% with 12 hours light-dark cycle.
This experiment was approved by the Institutional Animal Care and Use Committee of Daejeon University (approval number: DJUARB2012–019) for ethical and scientific validity of animal experiment and efficient management.
5. Phreatic Water (PW)
The water was collected from Paradise Spa Dogo, Korea. The component analysis of the PW of DOGO had been conducted in the research of researcher Jang [8], and drinking water test was investigated by Chungnam Institute of Health and Environment, Korea.
6. Sunblock Cream
The sunblock cream was purchased from Medi Spa Sunblock SPF 47/PA++ 70 ml (HUNUSBIO, INC, Korea) from medical-skincare.co.uk.
7. Reagent and Equipment
Experimental drugs used to measure whitening effect were tyrosinase mushroom, dimethyl sulfoxide (DMSO) and levo-3, 4-dihydroxyphenylalanine (L-DOPA) purchased from Sigma Chemical Co. (St. Louis, MO, USA). Those used for polymerase chain reaction (PCR) were extracellular regulated kinase (ERK), cAMP resposive element binding protein (CREB), microphthalmia associated transcription factor (MITF), tyrosinase, tyrosinase related protein 1 (TRP-1), tyrosinase related protein 2 (TRP-2), glyceraldehyde-3-phosphate dehydrogenase (GAPDH), primary antibody and secondary antibodies such as mouse-antigoat and rabbit-antimouse purchased from Santa Cruz Biotechnology (Santa Cruz, CA, USA).
For cell culture, Dulbecco’s modified Eagle medium (DMEM), fetal bovine serum (FBS), phosphate buffered saline (PBS), penicillin/streptomycin, and trypsin were purchased from Thermo Scientific Hyclone (Logan, UT, USA) and Gibco BRL Co. (Grand Island, NY, USA). For cytototoxicity measurement, a haemacytometer (Marienfeld-Superior, Germany) and 3-[4,5-dimethylthiazol]-2-yl]-2,5-diphenyl -tetrazoliumbromide (MTT) were purchased from Sigma Chemical Co.. For the HPLC reference sample, the Luteolin product was purchased from Sigma Chemical Co.. For other experimental drugs, first-class experimental drugs were used.
The EF analysis HPLC(Waters 2695 system; Waters Co., Milford, Mam USA) was the Agilent 1200 series, and the autosampler, the column oven, the binary pump, the DAD detector (Agilent Techonologies, Santa Clara, CA, USA), and the degasser (Agilent Technologies, Santa Clara, CA, USA) were used. The software used was Chemstation software (Agilent Technologies, Santa Clara, CA, USA).
Instruments used in this experiment includes the hot water extractor (DWT-1800T, Daewoong, Seoul, Korea), the reduced pressure distiller (EYELA, Tokyo, Japan/BUCHI B-480, Flawil, Switzerland), the centrifuge (Hanil Science Industrial, Incheon, Korea), the freeze dryer (Ilshin biobase Co., Dongduchun, Gyeonggi, Korea/EYELA FDU-540, Tokyo, Japan), the microscope (Olympus, Tokyo, Japan), the CO2 incubator (Vision Scientific, Daejeon, Korea), the vortex (Scientific Industries, INC., Bohemia, NY, USA), the pH meter (Mettler-Toledo AG, Greifensee, Switzerland), the BOD incubator (Daihan Scientific, Wonju, Gangwon, Korea), the autoclave (JS Research Inc., Gongju, Chungnam, Korea), the ELISA reader (Tecan, Mannedorf, Switzerland), the PCR (C-100, Bio-Rad Laboratories, Hercules, CA, USA), the plate shaker (Lab-Line, San Diego, CA, USA), the spectrophotometer (Shimazu, Kyoto, Japan), the biofreezer (Sanyo Electric Co., Osaka, Japan), the Applied Biosystems real time quantitative (RQ) PCR (Life Technologies, Grand Island, NY, USA), and the HPLC (Waters Co., Milford, MA, USA).
8. Manufacturing Cream of EF Extracts
The cream was made by combining water, oil, and stabilizer. These creams was mixed with the each additives(2% EF extracts and distilled water (DW) mixture or 2% EF extracts phreatic water (PW) or 0.5% SPF 47/PA++). The procedure of manufacture is as follows: after the water phase and oil phase materials were melted in main mixer and side mixer respectively in the temperature of about 70°C, the solutions were put into both mixers and the homo mixer was operated for 20 minutes. When it reached the emulsion state, the temperature was lowered to under 40°C and temperature-sensitive materials such as vitamins were put, and the pH was adjusted. Lastly the final stirring and 5-minute homo mixer was operated for 5 minutes, then it was filtered and filled(Table 1).
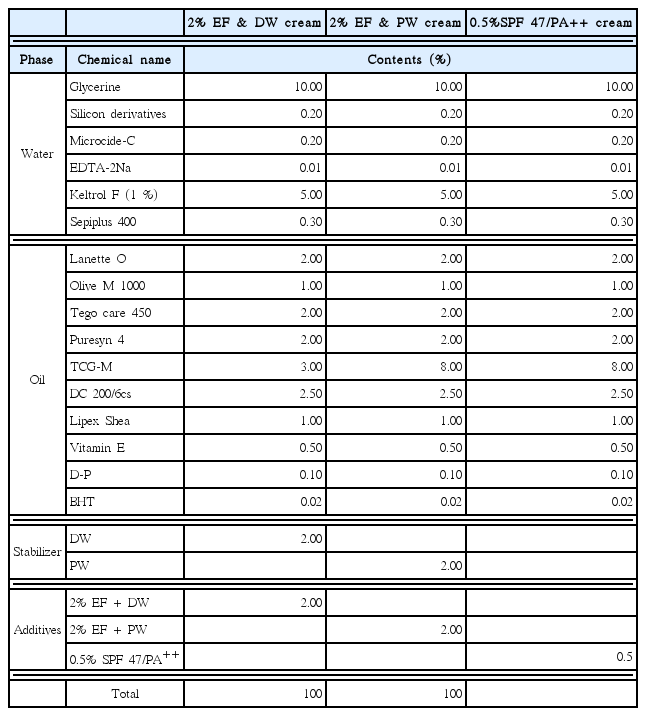
EF Cream Formulation
9. HPLC Effective Component Analysis of EF
The oven was conditioned at 25°C, 348nm wavelength, and 1.0ml/min flow rate for HPLC. The column used was the Luna C18 column (250mm × 4.6mm: particle size 5μm; Phenomenex, Torrance, CA, USA). 0.1% formic acid was added to 100% third DW(Solvent A), and 100% acetonitrile(Solvent B). Solvent gradient eluents for solvents are as shown in Table 2. Chlorogenic acid and isoquercitrin were used as the index component, and components of the reference sample and EF were analyzed.
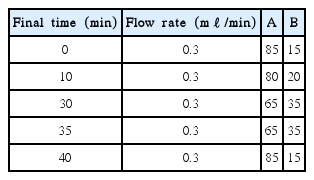
Solvent Gradient Condition for HPLC-DAD
10. Effects of EF on melanin synthesis in melanoma cells (in vitro)
1) Cytotoxicity measurement by MTT assay
The cytotoxicity was measured by the Carmichael method [9]. A total of 0.18ml of B16F10 cells was separately seeded in the 96 well plate by 5×10⁴ cells per well. Samples were prepared by concentrations, and 0.02ml of each sample was added into each well and the plate was placed and cultured in the 5% CO2 incubator for 24 hours. The control group was added with the same amount of DW as the sample group, and was cultured under the identical conditions. The MTT solution prepared in the 5mg/ml concentration was added at 0.02ml each, and the both groups were cultured for 4 hours. Then 0.15ml of dimenthyl sulfoxide was added to each for 30 minutes reaction. The optical absorbance was measured at 540nm by the ELSA reader. The cytotoxicity was indicated by the optical absorbance reduction ratio of the indication solution added and non-added group.
2) Tyrosinase inhibitory activity measurement of EF
The tyrosinase inhibitory activity was measured in accordance with the Yagi method [10]. In the reactor, 200 U/ml mushroom tyrosinase (40μl) was added to the mixture of the deposited solution (40μl), in which 10 mM L-DOPA was dissolved over 67 mM sodium phosphate buffer(pH 6.8; 80 μl), and the sample solution(40 μl). It was reacted for 10 minutes at 37°C. The DOPA chrome generated in the reaction solution was measured at 492nm. The tyrosinase reaction solution was measured at 492nm. The tyrosinase inhibitory activity was indicated by the optical absorbance reduction ratio of the indication solution added group and the nonadded group.
3) B16F10 cell experimental group classification
To identify the effect of EF when inducing melanin synthesis on B16F10 cells, the normal group received no treatment, the negative control group received only α-MSH (100 nM) treatment, the positive control group received α-MSH (100 nM) and kojic acid (50 ppm) treatment, and the experimental group received α-MSH (100 nM) and EF extracts treatment(5, 25, 50 μg/mℓ).
4) mRNA expression measurement by PCR
(1) Total RNA extraction and cDNA synthesis
B16F10 cells were seeded on the 100mm culture dish and cultured for 24 hours. These were treated with a-MSH (100 nM), EF(5, 25, 50μg/ml), and kojic acid (50 ppm) and cultured for 24 hours. Then, the culture medium was removed. The trizol lysis buffer was planted in each well by 1 ml for cell lysis, chloroform (200ml) was added to each, and the dish was shaken up and down for 20 seconds. It was centrifuged for 20 minutes at 13,200 rpm. The supernatant was collected and mixed in the tube that contained isopropanol (500ml). Then, it was centrifuged for 5 minutes at 13,200 rpm. The supernatant was removed then dried at room temperature. The DEPC was seeded in the 96-well plate by 50μl/well and melted. RNA (5 μg) and sterile water (195μl) were added in each well. Total RNA quantities were measured by measuring the optical absorbance at 260nm and 280nm respectively. Overall, 10 μl was made with Oligo(dT) 15primer (500 μg/ml) 1μl, extracted RNA (2 μg) and nuclease-free water. It was reacted for 5 minutes at 75°C. Then, 5X reaction buffer, MgCl2, PCR necleotide mix, rnasin inhibitor, reverse transcriptase, and nuclease free water were added. It was reacted for 5 minutes at 25°C, for 60 minutes at 42°C, and for 15 minutes at 70°C to synthesized cDNA.
(2) Reverse transcription (RT) PCR
Go Flexi DNA polymerase, primer, and synthesized cDNA was added in the PCR tube and fully blended, and PCR was conducted. The primer sequence used in the experiment is listed in Table 3. The GAPDH was kept for 30 seconds at 94°C, for 45 seconds at 55°C, and for 45 seconds at 72°C for 35 times. The tyrosinase was kept for 30 seconds at 94°C, for 45 seconds at 60°C, and for 45 seconds at 72°C for 40 times. The TRP-1, TRP-2, and MITF were kept for 30 seconds at 94°C, for 45 seconds at 58°C, and for 45 seconds at 72°C for 40 times. The MMP-1 was kept for 30 seconds at 94°C, for 60 seconds at 56°C, for 1 minute at 72°C for 35 times. After synthesis by PCR, it was treated with electrophoresis fir 49 minutes at 100 V in 1.5% agarose gel added with 0.002% ethidium bromide. The LAS 4,000 instrument (GE Healthcare Bio Sciences AB, Uppsala, Sweden) was used to measure the band for quantitative analysis.
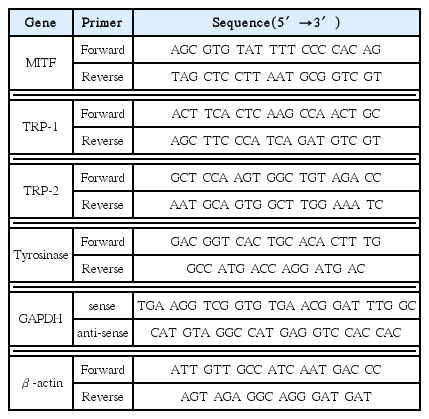
Primer Sequence (in B16F10 cell)
5) Protein expression measurement by Western blot
B16F10 cells were seeded on a 100-mm culture dish and cultured for 24 hours. These were treated with a-MSH (100 nM), EF (5, 25, 50 μg/ml), and kojic acid (50 ppm) and cultured for 24–48 hours. Then the culture medium was removed. After washing twice with phosphate buffered saline, RIPA buffer 10 ml added with the complete mini 1 tab was dissolved into 100μl. Then, it was centrifuged for 20 minutes at 4°C, 12,000 rpm. The centrifuged supernatant was quantified by the Bradford assay, and 30 μl protein was separated by electrophoresis (sodium dodecyl sulfate polyacrylamide gel electrophoresis) using 10% gel. The semidry transfer cell instrument (Hofer, Inc., San Francisco, CA, USA) was used to move the separated protein on the polyvinyl difluoride membrane(PVDF). Then, it was cultured in the blocking buffer (5% skim milk in Tris buffered saline with Tween) for 1 hour at room temperature. The primary antibody (PKA, β-actin) was diluted and kept overnight at 4°C. It was washed using Tris buffered saline with Tween for three times at 10-minute intervals. The secondary antibody(anti rabbit, anti goat) was diluted by 1 : 1,000, and cultured for 2 hours at room temperature. Then, it was washed for three times. The LAS 4000 instrument(GE Healthcare Bio Sciences AB, Uppsala, Sweden) was used to measure the band for quantitative analysis.
6) Statistical analysis
Every experiment was repeated three times to obtain the average and standard deviation values. SPSS version 10.0 (Chicago, IL, USA) software was used to process the statistical results. For significant difference verification, significance was analyzed using Turkey/s honest significant difference test at α = 0.05 level after analysis of variance (*p<0.05, **p<0.01, ***p<0.001).
11. Effect of EF with PW on melanin synthesis in HRM-2 melanin-possessing hairless mice(in vivo)
Each HRM-2 mice were applied with specimen on the right dorsal skin, and the melanin synthesis was compared with the untreated left dorsal skin after UVB irradiation.
1) HRM-2 mice experimental group classification
The experimental groups were classified as the following. The normal group was applied with the base ointment on the right dorsal skin. The negative control group was treated with the base ointment and UVB irradiation, and the positive control group was treated with 0.5% sunblock cream and UVB irradiation. The Experimental group 1 was treated with EF+DW cream and UVB irradiation on the right upper side, and the experimental group 2 was treated with EF+PW cream and UVB irradiation on the right lower side of dorsal skin.
2) UVB irradiation and hyperpigmentation induction
The UVB lamp (15 W type, UV maximum wave length 312nm; UV intensity 100μW cm−2, Ieda Boeki Co., Tokyo, Japan) was used to irradiate UVB on the dorsal skins of 7-week-old HRM-2 mice to identify the effect of 2% EF+DW and 2% EF+PW on changes in skin thickness, elasticity, and pigmentation. The base ointment and each sample were blended into the form of cream (0.5% sunblock cream, 2% EF + DW cream, 2% EF + PW cream). It was applied on the right dorsal skin of each HRM-2 mouse, and no treatment was made on the left dorsal skin. Each mouse was anesthetized and irradiated with UVB from a 30cm distance for 5 minutes at a time. UVB was irradiated three times a week for 4 weeks. Based on studies on UVB using animal whitening experiments [11,12], the experimental duration was configured for a total of 5 weeks.
3) Visual pigmentation observation
To visually observe the dorsal skin in which pigmentation was induced by UVB irradiation, applied parts of the solvent control group and the sample group were observed for three times on the 1st, 3rd, 5th week after the experiment was launched to compare the colored skin states of experimental animals for whitening effect. Mice were etherized, and a digital camera (D 70 model; Nikon, Tokyo, Japan) was used to take pictures of skin surface states.
4) Software analysis on pigmented images
To analyze the images taken by the digital camera on the 1st, 3rd, 5th week after the experiment started, the image analysis software (Bio-Rad, USA) was used. To compare melanin deposition from the entire dorsal part, the untreated left dorsal part and the treated right dorsal part were distinguished. The melanin deposition level was derived from the difference between the pigmented areas of the left dorsal skin and the right dorsal skin.
5) mRNA expression measurement by PCR
To identify how much influence 2% EF + DW and 2% EF + PW has to UVB irradiation for TRP-1, TRP-2(key enzymes of melanin synthesis) and MMP-9(key enzyme of aging) synthesis, the dorsal skin tissue was extracted from each HRM-2 mouse and mRNA level for each enzyme was measured through RQ PCR analysis.
(1) Total RNA extraction and cDNA synthesis
The dorsal skin tissue was extracted from each HRM-2 mouse, RNAzolB (500μl) was added, and was crushed with a homogenizer. Then 50 μl chloroform (CHCl3) was added, and the mixture was blended for 15 seconds. It was left on ice for 15 minutes and centrifuged at 13,000 rpm. A supernatant of approximately 200μl was collected and mixed with 2-propanol (200μl), then shaken slowly and left for 15 minutes on ice. It was centrifuged at 13,000rpm again, washed with 80% EtOH and dried by vacuum pump for 3 minutes. Then RNA was extracted. The extracted RNA was dissolved in the DEPC-treated DW (20μl). It was deactivated in the heating block at 75°C and was used in the first-strand cDNA synthesis.
(2) Reverse transcription
The total RNA (3μl) extracted from the dorsal skin tissue of the HRM-2 mouse was denaturized for 10 minutes at 75°C. 2.5μl 10mM dNTPs mix, 1μl random sequence hexanucleotides (25pmol/25μl), 1μl RNase inhibitor (20 U/μl) as the RNA inhibitor, 1μl 100mM DTT, and 4.5 μl 5 × RT buffer (250mM Tris–HCl, pH 8.3, 375mM KCl, 15mM MgCl2) were added, and then 1μl M-MLV RT (200 U/μl) was added to the mixture again to make the final volume of DEPC-treated DW to be 20μl. This 20μl reaction mixture solution was fully stirred and was centrifuged for 5 seconds at 2000 rpm. It was reacted for 60 minutes in the heating block at 37°C to synthesize the first-strand cDNA. It was left at 95 °C for 5 minutes to deactivate the M-MLVRT. Finally, the synthesized cDNA was used for PCR.
(3) RQ PCR
The Applied Biosystems 7500 Real-Time PCR system was used for RQ PCR, and the primer sequence used in the experiment is given in Table 4.

Primed Sequences (in HRM-2 mice)
The SYBR Green primer for MMP-9, TRP-1, TRP-2 mRNA gene expression was analyzed with SYBR Green PCR MasterMix (ABI), and taqman probe for GAPDH (pn,4352339E, VIC dye-labelled, ABI) were selected using Assays-on-Demand Gene Expression Products (ABI). Glyceraldehyde-3-phosphate dehydrogenase(GAPDH) (ABI) gene expression was used as an endogenous control.
For RQ PCR conditions, pre-denaturation was conducted for 2 minutes at 50°C and for 10 minutes at 94°C, and 40 cycles of denaturation were conducted for 15 seconds at 95°C and for 1 minute at 60°C. GAPDH was used as the internal standard for the experimental group and the control group. The relative quantitative value of the target group was calculated by RQ PCR using the following equation: y = x(1 + e)n, where y is the yield, x is the starting quantity, n is the number of cycles, and e denotes efficiency.
6) Histological observation of skins
To observe the optical microscopic change in the skin tissue, the extracted tissue was fixed in a 100% neutral formalin solution for 12 hours and washed with running water. It was hydrated with 70%, 80%, 95%, and 100% ethanol, and made transparent with xylene. After the penetration process, it was embedded with paraffin. The microtome was used to make the 4μm-thick microsection from the produced paraffin block. Xylene was used to deparaffinize the microsection, which was then washed with salty water and tap water to dye it suitable for the purpose. To observe the general change of the skin tissue, it was placed in the Harris hematoxylin solution for 5 minutes to dye the nucleus. Then, it was washed with running water. It was deposited for three times with 1%HCl–alcohol solution and was fully washed. A 1% ammonium solution was used to color it blue, and it was moved to 80% alcohol. Next, 95% alcohol and 100% alcohol were used to dehydrate it. After it cleared, it was enclosed with Canadabalsam and then placed under the microscope for inspection.
7) Statistical analysis
The unpaired student t test statistics was used to process each experimental group result, and significance was determined at levels not greater than p<0.05 (*p<0.05, **p<0.01, ***p<0.001).
12. Human skin safety test of EF added cosmetics
To identify whether EF occurs skin inflammation, a patch test was implemented as a simple pre-test. Various types of cosmetics(toner, lotion and cream) containing EF kept at room temperature for 30 days were patched on soft underarm skin of 20 adults, sealed with Finn chamber on Scanpor tapes, and kept for 24 hours. The skin response was observed with naked eyes. The test was based on the method of Waggoner [13], Matsumura H [14], Aberer W [15], and the criteria was based on the international society of contact dermatitis as in Table 5.
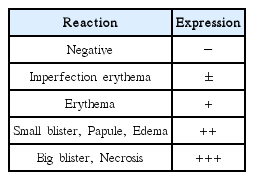
The Expression Method of Patch Test
Results
1. Effective HPLC component analysis on EF
For behaviors of standard materials contained in EF contents, patterns of the standard material chlorogenic acid and isoquercitrin were identified with the pattern of EF respectively, by matching the retention times through HPLC with diode array detection. Among 70% ethanol extracts of EF, the amount of chlorogenic acid was 4.52mg/g (Fig. 1A), and isoquercitrin was 0.94mg/g (Fig. 1B).
HPLC chromatogram of standard chlorogenic acid, isoquercitrin and Eriobotryae Folium(EF)
(A) Chromatograms of standard chlorogenic acid and EF are recorded at 325 nm.
(B) Chromatograms of standard isoquercitrin and EF are recorded at 353 nm.
2. Effect of EF on melanin synthesis in melanoma cell (in vitro)
1) Cytotoxicity
Cytotoxicity of EF on the B16F10 cell was identified by MTT assay. High survival rate was shown in concentrations of 5, 10, 50, 100, 500 μg/ml, which were 104.2%, 98.6%, 95.8%, 95.7%, 93.5% respectively. In the concentration of 1000g/mL the survival rate was 75.0% which is significantly reduced than the control group (p<0.05). As the result, little cytotoxicity was exhibited from every concentration from 5g/mL to 500g/mL. Therefore, for the whitening related signal transfer factor measurement in B16F10 cell, concentrations of high survival rate, 5g/mL, 25g/mL, and 50g/mL, were tested.
2) Tyrosinase inhibitory activation
As the result of tyrosinase activation inhibitory effect of EF, the concentrations of 500g/mL and 1000g/mL showed significant activation inhibition rate (p<0.001). The activation inhibition rate was higher in higher EF concentration, and 1000g/mL showed the highest 50% activation inhibition (Fig. 2).

Effect of Eriobotryae Folium on tyrosinase activation inhibition in B16F10 cell.
B16F10 cells were treated with various concentration of EF (5, 10, 50, 100, 500,1,000 μg/mℓ). Then the cells were tested tyrosinase inhibitory activation.
The results represent the mean ± S.D. of three individual experiments. Statistically significant value was calculated by Turkey’s HSD test(*p<0.05, **p<0.01, ***p<0.001).
3) TRP-1 mRNA gene expression
TRP-1 mRNA gene expression was lower than the negative control group in every concentrations, and the gene expression decreased as EF concentration increased. In all concentrations, the TRP-1 mRNA gene expression was lower than the positive control group (Fig. 3A).
Effect of Eriobotryae Folium on mRNA and PKA protein expression in B16F10 cell.
B16F10 cells were seeded on 100 mm culture dish. After 24 hours, cells were treated with α-MSH, EF (5, 25, 50 μg/mℓ) or kojic acid (50 ppm) for 24 hours. mRNA expression was analyzed with RT PCR and PKA protein expression was analyzed with Western blot.
The results represent the mean ± S.D. of three individual experiments. Statistically significant value was calculated by comparing with negative control group using Turkey’s HSD test(*p<0.05, **p<0.01, ***p<0.001).
Negative control : α-MSH (100 nM) treatment
Normal : non treatment
Positive control : α-MSH (100 nM) and kojic acid (50 ppm) treatment
EF (5, 25, 50) : α-MSH (100 nM) and EF (5, 25, 50μg/mℓ) treatment.
(A) TRP-1 mRNA (B) TRP-2 mRNA (C) Tyrosinase mRNA
(D) MITF mRNA (E) PKA protein (F) ERK mRNA
4) TRP-2 mRNA gene expression
TRP-2 mRNA gene expression was higher than the negative control group in every concentrations, and the gene expression decreased as EF concentration increased. The TRP-1 mRNA gene expression was higher than the positive control group in concentrations of 5 μg/ml and 25 μg/ml, and was lower in the concentration of 50 μg/ml (Fig. 3B).
5) Tyrosinase mRNA gene expression
Whereas tyrosinase mRNA gene expression was significantly higher in 5 μg/ml concentration compared to the only a-MSH treated negative control group, it was significantly lower in 25 μg/ml and 50 μg/ml concentrations (p<0.001). The tyrosinase mRNA gene expression decreased as the EF concentration increased. Also, the gene expression was lower than the positive group in all concentrations (Fig. 3C).
6) MITF mRNA expression
MITF mRNA gene expression was significantly decreased in all concentrations compared to the only a-MSH treated negative control group. As the concentration increased MITF mRNA gene expression decreased. Also, MITF mRNA gene expression was higher in 5 μg/ml concentration, and lower in 25 μg/ml and 50 μg/ml concentrations compared to positive control group (Fig. 3D).
7) PKA protein expression
PKA protein expression was increased in 5μg/ml and 25μg/ml concentrations compared to the only a-MSH treated negative control group. As the concentration increased PKA protein expression decreased. Also, PKA protein expression was higher in all concentrations compared to the positive control group (Fig. 3E).
8) ERK mRNA expression
ERK mRNA gene expression was increased in every concentration compared to the only a-MSH treated negative control group (p<0.001). As the concentration increased ERK mRNA gene expression also increased. Also, ERK mRNA gene expression was lower than the positive control group in 5 μg/ml concentration, and was higher in 25 μg/ml and 50 μg/ml concentration (Fig. 3F).
3. Effect of EF with PW on melanin synthesis in HRM-2 melanin-possessing hairless mice (in vivo)
1) Image analysis software
Melanin difference between the untreated left dorsal skin and the specimen applied right dorsal skin was like the following (Fig. 4, Table 6).
Effect of Eriobotryae Folium& phreatic water on pigmentation in dorsal skin of HRM-2 mice exposed to UVB.
Five weeks after the initiation of UVB irradiation (the stage of hyperpigmentation) Dorsal skin left part and right part photograph image analysis. The dorsal skin whitening values showing brightness of skin color were measured using image analysis software (each system ships with one full version of Quantity One and unlimited copies of Quantity One Basic Mode.).
The results represent the mean ± S.E.(n=6). Statistically significant value was calculated by comparing with negative control group using student t test(*p<0.05, **p<0.01, ***p<0.001).
Normal : base ointment application
Negative control : UVB irradiation and base ointment application
Positive control : UVB irradiation and 0.5% sunblock cream application
Experimental 1 : UVB irradiation and 2% EF + DW cream application
Experimental 2 : UVB irradiation and 2% EF + PW cream application
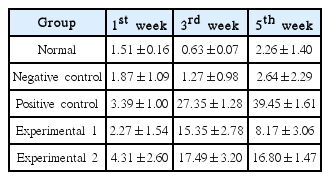
Melanin Difference between Untreated Part(left) and Treated Part(right)
On the first week the experimental groups 1 and 2 were higher but not significantly different from the negative control group.
On the third week the experimental groups 1 and 2 were significantly higher from the negative control group (p<0.001). The experimental group 1 was 12.1 times higher than the negative control group, and the experimental group 2 was 13.8 times higher. On the contrary, the melanin difference of the positive control group was 21.5 times higher than negative control group, which is higher than the experimental groups 1 and 2.
On the fifth week, the melanin difference of the experimental group 2 was 6.4 higher than the negative control group, which is significant (p<0.001).
The experimental group 1 was 3.1 times higher than negative control group, but it was not significant. On the contrary, the positive control group was 14.9 times higher than negative control group, and it was higher than experimental groups 1 and 2.
The experimental group 2 was 1.9 times higher on the first week, 1.1 times higher on the second week, and 2.1 times higher on the fifth week compared to the experimental group 1.
2) RQ PCR analysis
(1) TRP-1 mRNA expression
TRP-1 mRNA gene expression of the experimental group 1 was significantly lower than the negative control group by 26.64% (p<0.05), and that of the experimental group 2 was lower than the negative control group by 30.99% (p<0.01). On the other hand, the positive control group was significantly lower than the negative control group by 42.90% (p<0.01). Also, TRP-1 mRNA gene expression of the experimental group 2 was about 5.93% lower than the experimental group 1(Fig. 8A).
Effect of Eriobotryae Folium & phreatic water on mRNA expressions in dorsal skin of HRM-2 mice.
HRM-2 mice were sacrificed, and mRNA expression were checked in dorsal skin. mRNA expressions were analyzed with RQ PCR. The results represent the mean ± S.E (n=6). Statistically significant value was calculated by comparing with negative control group using Student t test (*p<0.05, **p<0.01).
Normal : base ointment application
Negative control : UVB irradiation and base ointment application
Positive control : UVB irradiation and 0.5% sunblock cream application
Experimental 1 : UVB irradiation and 2% EF + DW cream application
Experimental 2 : UVB irradiation and2% EF + PW cream application
(A) TRP-1 mRNA expression (B) TRP-2 mRNA expression (C) MMP-9 mRNA expression
(2) TRP-2 mRNA gene expression
TRP-2 mRNA gene expression of the experimental group 1 was 13.27% lower than the negative control group, and the experimental group 2 was 13.16% lower than the negative control group, both of which are not significant. On the other hand, the positive control group was significantly lower than the negative control group by 28.37% (p<0.01). Also, TRP-2 mRNA gene of the experimental group 1 and 2 were similar by 0.804 and 0.805 respectively (Fig. 8B).
(3) MMP-9 mRNA gene expression
MMP-9 mRNA gene expression of the experimental group 1 was 24.75% lower than the negative control group, and the experimental group 2 was 36.18% lower than the negative control group, both of which are not significant. On the other hand, the positive control group was significantly lower than the negative control group by 65.40% (p<0.01). Also, MMP-9 mRNA gene expression of the experimental group 2 was lower than the experimental group 1 by 15.20% (Fig. 8C).
3) Histological analysis
After the experiment, the dorsal skin of the HRM-2 mouse was extracted and dyed with hematoxylin and eosin to assess whether EF and PW can inhibit the damage of UVB irradiated dorsal tissue. The analysis showed that the epidermis of the negative control group was excessively formed and expanded, and hyperkeratinization, pigmentation, granulation, and parakeratosis infiltration was observed, which indicates tissue damage by UVB irradiation. The epidermis of the positive control group, experimental group 1, and experimental group 2 was thinner close to the normal group, and the pigmentation, cell transformation, keratinization, and infiltration were also similar to the normal group. Especially in case of the EF+PW used experimental group 2, the epidermis was thinner closer to the normal group compared to the only EF used experimental group 1(Fig. 9).
Histological analysis of HRM-2 mice dorsal skin.
HRM-2 micewere sacrificed, and dorsal skin were processed for histology and stained with hematoxylin and eosin. It shows the thickening of epidermis by bright microscope.
We removed HRM-2 mice dorsal skin and analyzed with hematoxylin and eosin staining. The results were evaluated the degree of epidermal thickening, hyperpigmentation and histopathological changes in skin tissues. We observed skin tissues through an optical microscope.
Normal : base ointment application
Negative control : UVB irradiation and base ointment application
Positive control : UVB irradiation and 0.5% sunblock cream application
Experimental 1 : UVB irradiation and 2% EF + DW cream application
Experimental 2 : UVB irradiation and 2% EF + PW cream application
4. Human skin safety test of EF added cosmetics
To identify whether EF occurs skin inflammation, a patch test was implemented as a simple pre-test. As the result, negative reaction occurred in all 20 subjects (Fig. 10).
The patch test photograph of the cosmetics containing Eriobotryae Folium extracts.
NS : Toner not contaning Eriobotryae Folium extracts
NL : Lotion not contaning Eriobotryae Folium extracts
NC : Cream not contaning Eriobotryae Folium extracts
CS : Toner contaning Eriobotryae Folium extracts
CL : Lotion contaning Eriobotryae Folium extracts
CC : Cream contaning Eriobotryae Folium extracts
Discussion
Melanin plays the most important role in determining skin color. It is synthesized by melanosome of melanocyte existing in epidermis, and moves to keratinocyte through dendrite to create color [16].
The primary role of melanin is to eliminate active oxygen in skin, and block ultraviolet ray (Compilation Committee of Dermatology Textbooks., 2001). However, excessive pigmentation of melanin can cause negative effects such as freckles, skin aging, skin cancer, and cell death [16]. Melanin synthesis starts by tyrosine hydroxylase activation which converts tyrosine into DOPA by tyrosinase, and by DOPA oxidase activation which oxidizes DOPA into DOPA quinone [17]. Melanosome contains enzymes that generate normal melanine. Tyrosinase, tyrosinase-related protein 1 (TRP-1), tyrosinase-related protein 2 (TRP-2) are the well-known enzymes [18,19,20].
In the intracellular signal pathways, when melanin cells are activated and melanin synthesis proceeds, activation of adenylate cyclase increases, and cAMP density increases.
Protein kinase A (PKA) is cAMP dependent protein kinase which controls various enzyme activation, and it is related to cellular multiplication [21]. So the activation of PKA induces tyrosinase phosphorylation. When PKA expression is inhibited, melanin synthesis is inhibited through the blockage of tyrosinase activation. Also, MITF is an important transcription control factor in the melanin synthesis process, which moves to nucleus and increases DNA activation of tyrosinase, TRP-1 and TRP-2 and promotes melanin synthesis. Therefore, inhibition of MITF can inhibit the expression of tyrosinase, TRP-1 and TRP-2, which eventually inhibits melanin synthesis [22].
Extracellular regulated kinase (ERK) is the intracellular signal transfer protein and is known as a factor that controls gene expression [23]. Recent studies show that the activation of ERK pathway suppresses melanin synthesis as MITF decreases through ubiquitination [24]. Thus, when ERK expresseion increases, melanin synthesis may be inhibited. An effective and stable whitening material should inhibit the signal pathways and the gene expression of enzymes involved in melanin synthesis. The melanin inhibition effect of the whitening materials can be judged by evaluating their effects on tyrosinase, TRP-1, TRP-2, MITF, PKA, and ERK.
In this research, in vitro and in vivo experiments were conducted to evaluate the whitening effect of a natural material EF, which has been widely used for various skin diseases. In the animal experiment using HRM-2 melanin-possessing hairless mice, phreatic water (PW), long known to be effective to skin enhancement, was used to assess whether the effect can be increased when combined with EF. Also, a patch test was conducted as a pre-test to confirm safety for the future clinical experiments.
As the result of HPLC analysis, the volume of the index ingredient chlorogenic acid was 4.52mg/g and isoquercitrin was 0.94mg/g among 70% EF ethanol extracts(Fig. 1).
Chlorogenic acid is 3-(3, 4-dihydroxycinnamoyl) quinate, which is the ester of caffeic acid and (L)-quinic acid. It is known to be widely distributed in crude drugs or foods such as coffee, and is a natural organic compound that is synthesized in vivo. It has fewer side effects and has anti-virus, anti-bacteria, and anti-fungal effects. Its blood glucose and blood pressure regulatory effects are also known [25]. The study of Im [26] found out that acanthopanax extract has the melanin inhibitory effect by reducing the amount of tyrosinase and TRP-2 expressions in melanoma cells, and chlorogenic acid and caffeic acid were suggested as the effective ingredients. Therefore, chlorgenic acid in EF is considered to be playing an important role in the whitening effect by suppressing major enzymes and signaling pathways related to melanin synthesis.
Isoquercitrin is the glycoside of quercetin, a type of polyphenol, and is known to have various medical effects such as antioxidant, anti-inflammation, anti-allergy, anti-cancer, hypertension and hyperlipidemia inhibition effects [27]. In the research of Jo [28], it was proved that isoquercitrin has an excellent cell protective effect by increasing the survival rate of the oxidative damage induced HaCaT cells, and the feasibility of isoquercitrin to skin aging by active oxygen was suggested. In this research, it was found that EF breaks down proteins such as collagen and reduces the expression of MMP-9 mRNA which fosters aging. This is assumed to be related to cell protective effect, and additional studies seem to be necessary in the future.
From the in vitro experiment using B16F10 cells, it was found that EF inhibits tyrosinase activation and TRP-1 mRNA, tyrosinase mRNA, MITF mRNA expressions, and the extract also inhibits melanin synthesis by promoting ERK mRNA expression; this suggests the whitening effect of EF. All of the results were statistically significant, and it was more effective than the positive control group kojic acid. Despite the fact that the inhibitory effect of EF on TRP-2 mRNA and PKA protein expression was smaller than the negative control group, the expression tended to be reducing dependently as the EF concentration increased. Additional research on this seemes to be necessary in the future.
The image analysis software from in vivo experiment using HRM-2 melanin-possessing hairless mice showed that EF + PW had an excellent inhibitory effect on melanin synthesis. Larger melanin difference between the untreated left dorsal skin and the specimen applied right dorsal skin means that the specimen has higher melanin synthesis inhibitory effect. The experimental groups 1 and 2, which are applied with EF cream, had more inhibitory effect than the negative control groups. Also, the experimental group 2, applied with EF + PW cream, had higher inhibitory effect than the experimental group 1, applied with EF + DW cream, which means that PW enlarges the whitening effect when combined with EF. However, the inhibitory effect did not reach the positive control group applied with 0.5% sunblock cream, leaving more experiments to be continued along the effort to enlarge the whitening effect of EF.
According to the RQ PCR analysis of mRNA expressions on HRM-2 mice dorsal skins, EF had the whitening effect by inhibiting melanin synthesis by suppressing TRP-1, TRP-2 mRNA expressions, and the effect was enlarged when used with PW. EF inhibited TRP-1 mRNA expression more significantly, which was consistent with the previous in vivo experiment in which EF inhibited TRP-1 better than TRP-2. MMP-9 is a zinc-dependent protease which breaks down extracellular matrix. When the activation increases proteins such as collagen in skin collapse, and forms wrinkles that progress aging [29]. It is expected that EF would block skin aging by inhibiting MMP-9 mRNA expression, along with the whitening effect through melanin control. The effect would also be enlarged when used with PW. Histological analysis of HRM-2 mice dorsal skin showed that EF and PW visually inhibited melanin synthesis on skin surface and the enzymes involved, and they also act as the skin protectants from extreme pigmentation and aging, histologically.
Put together the above in vivo experiment using HRM-2 melanin-possessing hairless mice, EF inhibited melanin synthesis on UVB iradiated dorsal skins, it suppressed gene expression related to melanin and skin aging, and the result was observed histologically. Also, the effects were enhanced when PW was combined.
A patch test was conducted as a pre-test to for further clinical experiments, and the result showed negative response on all 20 male and female adult subjects, which indicates low possibility of problems such as inflammation. However, further researches are necessary before clinical commercialization of EF based products.
Above researches showed various mechanisms and effects of EF inhibiting melanin synthesis. Also, the effect was enlarged when EF was combined with PW. Therefore, EF and PW are expected to be actively used in further researches on development of natural whitening materials based on this paper.
However, the number of objects in this research were limited, so continuous studies are necessary. Clinical experiments on human bodies are also required as well as animal experiments. According to Seo’s research [30], EF contains a toxic component amygdalin, so there is a possibility to various side effects. The dosage and hair removal is also required in order to prevent poisoning. In order for EF to be used widely, additional studies on side effects are necessary.
If further systematic researches on finding the exact mechanisms of melanin inhibition effect of EF and the development of various forms of the materials are continued, natural cosmetics and medicines for whitening and treating pigmentation would be able to be developed.
Conclusion
According to the HPLC analysis, the amount of chlorogenic acid was 4.52mg/g, and isoquercitrin was 0.94mg/g among 70% ethanol extracts of EF.
From the in vitro experiment using B16F10 cells, it was found that EF inhibits tyrosinase activation and TRP-1 mRNA, tyrosinase mRNA, MITF mRNA expressions, and the extract also inhibits melanin synthesis by promoting ERK mRNA expression; this suggests the whitening effect of EF. All of the results were statistically significant.
From the in vivo experiment using HRM-2 melanin-possessing hairless mice, the melanin difference between group 1 and 2 was significant on the third and fifth week of UVB irradiation. RQ PCR analysis showed that TRP-1 mRNA expression of group 1 and 2 was significantly inhibited, and TRP-2 mRNA, MMP-9 mRNA expressions were also inhibited but not significantly. In the histological analysis, EF extracts prevented skin damages such as thickness of the epidermis, hyperpigmentation in the peripheral cells, cell mutation, keratinization, and infiltration. In all of the above in vivo experiments, the experimental group 2 showed better melanin synthesis and tissue damage inhibitory effects than the experimental group 1.
The patch test showed negative reactions in all 20 adult subjects.
Image analysis of negative control group
Image analysis of treated part(right, only base ointment application) compared to untreated part(left) after UVB irradiation. Mean means peak area of a half dorsal skin calculated using image analysis software (n=6).
(A) After 1 week UVB irradiation (B) After 3 weeks UVB irradiation (C) After 5 weeks UVB irradiation
Image analysis of positive control group
Image analysis of treated part(right, 0.5% sunblock cream application) compared to untreated part(left) after UVB irradiation. Mean means peak area of a half dorsal skin calculated using image analysis software (n=6).
(A) After 1 week UVB irradiation (B) After 3 weeks UVB irradiation (C) After 5 weeks UVB irradiation
Image analysis of experimental group
Image analysis of treated part(upper right, 2% EF + DW cream application; lower right, 2% EF + PW cream application) compared to untreated part(left) after UVB irradiation. Mean means peak area of a quarter dorsal skin calculated using image analysis software (n=6).
(A) After 1 week UVB irradiation (B) After 3 weeks UVB irradiation (C) After 5 weeks UVB irradiation
Abbreviations
EF
Eriobotryae Folium
DW
distilled water
PW
phreatic water
HPLC
high performance liquid chromatography
RT PCR
reverse transcription polymerase chain reaction
RQ PCR
real time quantitative polymerase chain reaction
TRP-1
tyrosinase related protein-1
TRP-2
tyrosinase related protein-2
PKA
protein kinase A
MITF
microphthalmia-associated transcription factor
ERK
extracellular regulated kinase
MMP-9
matrix metalloproteinase-9
Notes
Declarations
1. Ethics approval and consent to participate
This experiment was approved by the Institutional Animal Care and Use Committee of Daejeon University (approval number: DJUARB2012-019) for ethical and scientific validity of animal experiment and efficient management.
2. Consent for publication
Not applicable
3. Avaliability of data and material
Data supporting our findings are contained within the manuscript.
4. Competing interest
The authors declare that they have no competing interests.
5. Funding
This research was supported by the Daejeon University fund(2013)
6. Authors’ contributions
T.W.A. have been involved in conducting the research. J.H.P collected the background data, and T.W.A wrote the first draft of the manuscript. All authors participated in the revision of subsequent drafts, and all approved the final version of the manuscript.
Acknowledgements
This research was supported by the Daejeon University Research Grants (2016).