Clinical Report of Various Postpartium Symptoms
Article information
Abstract
Objectives
The purpose of this study is to investigate the various postpartum symptoms and the relevant factors. So it can provide fundamental data about postpartum health care. In conclusion, we can prevent and manage the postpartum disease by using this data.
Methods
The subject of the present study was 94 women (63 women who completed vaginal delivery and 31 women who delivered by cesarean section) who completed labor between November 1, 2013 and January 31, 2016, at the clinic of OB&GYN. They have been taking good care of their health at postpartum clinic in Andong Woori Women Hospital. We investigated the various symptoms and situation which occurred from the moment of hospital to postnatal admission health care period, and Korean medical doctor examined the patients through the four examination methods. We classified the symptoms by maternal age, the frequency of maternal childbirth, the method of delivery, the delivery season, the term of pregnancy, the body weight of infant, the weight change of mother and the way of feeding.
Results
There were no remarkable corelation in the frequency of symptoms according to maternal age, the way of delivery, the delivery season, the change of weight before and after of delivery, gestational weeks at delivery, the manner of feeding and the body weight of infants except for the frequency of maternal childbirth.
Conclusion
The symptoms of hemorrhoids, the feeling of coldness and chilliness increased with increasing the frequency of maternal childbirth. Other circumstances, there was no relationship with symptoms of postpartum.
The distribution of postpartum symptoms on the whole 94 women
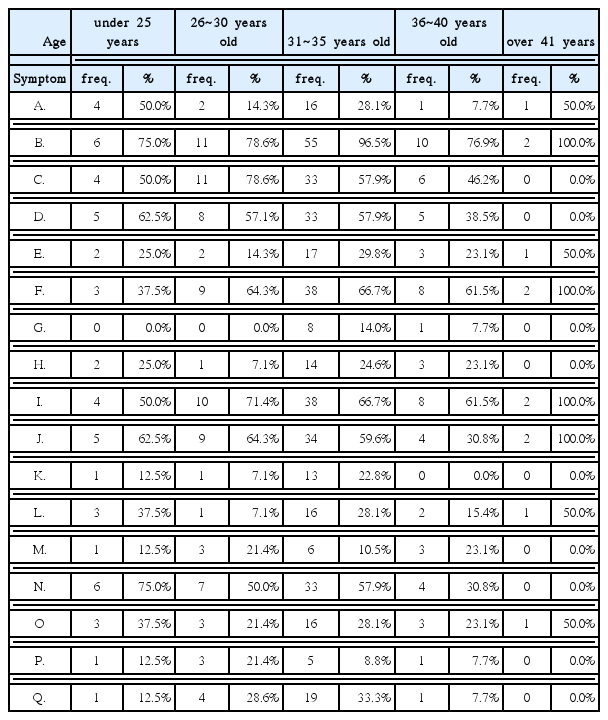
The Variance Analysis of Postpartum Symptoms Depending on Maternal Age
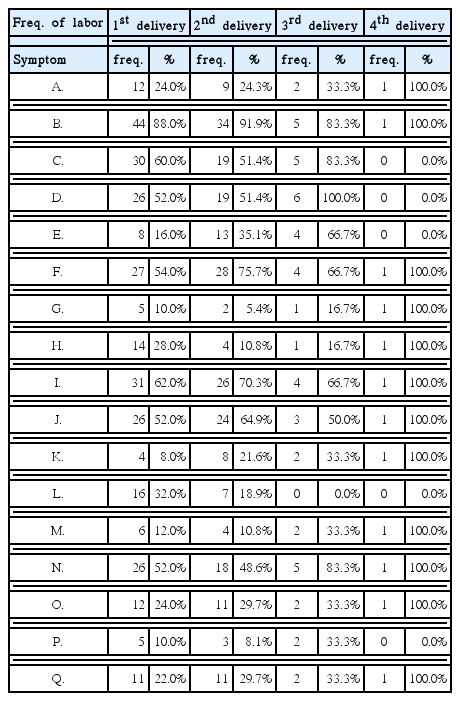
The Variance Analysis of Postpartum Symptoms Depending on the Frequency of Maternal Childbirth
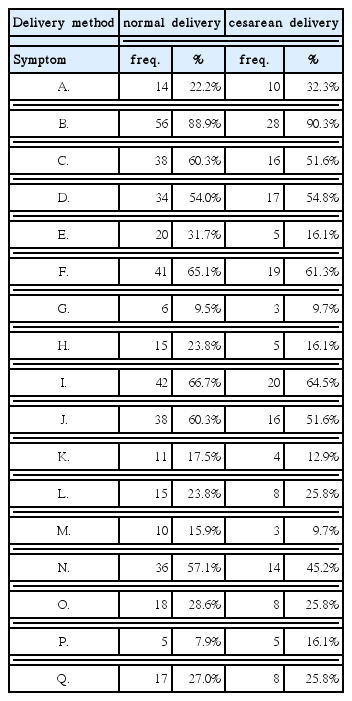
The Variance Analysis of Postpartum Symptoms Depending on the Delivery Methods of Pregnant Women
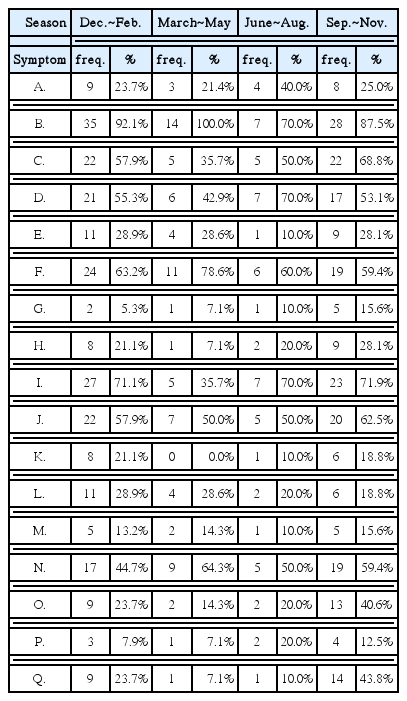
The Variance Analysis of Postpartum Symptoms Depending on the Delivery Season
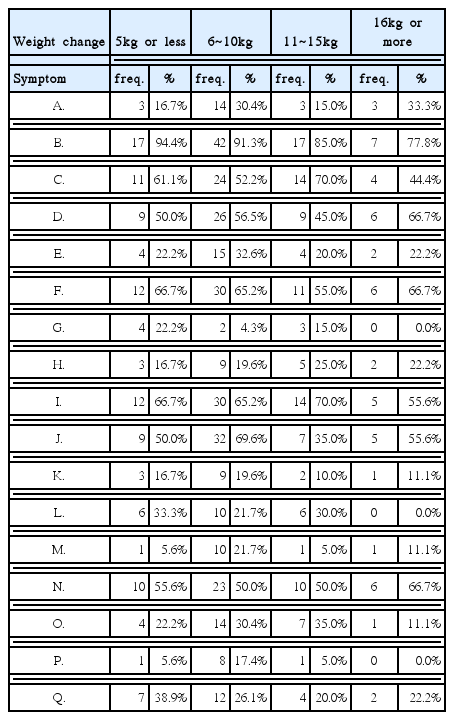
The Variance Analysis of Postpartum Symptoms Depending on the Changes in Maternal Body Weight
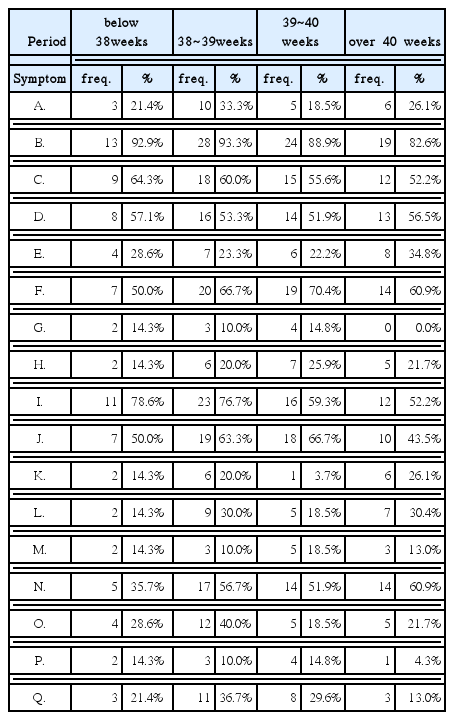
The Variance Analysis of Postpartum Symptoms Depending on the Maternal Childbirth Weeks
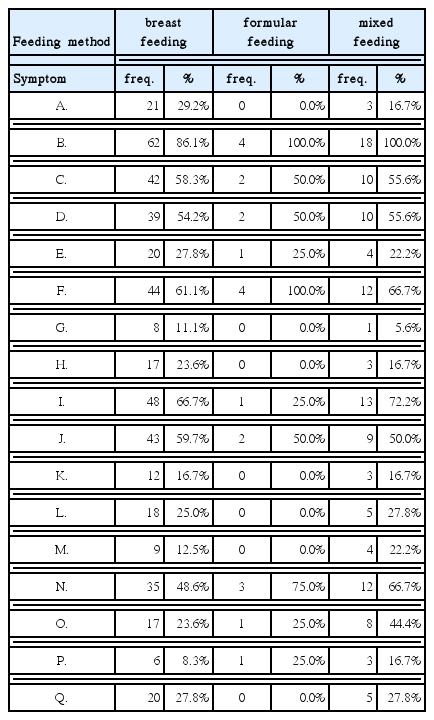
The Variance Analysis of Postpartum Symptoms Depending on the Feeding Methods
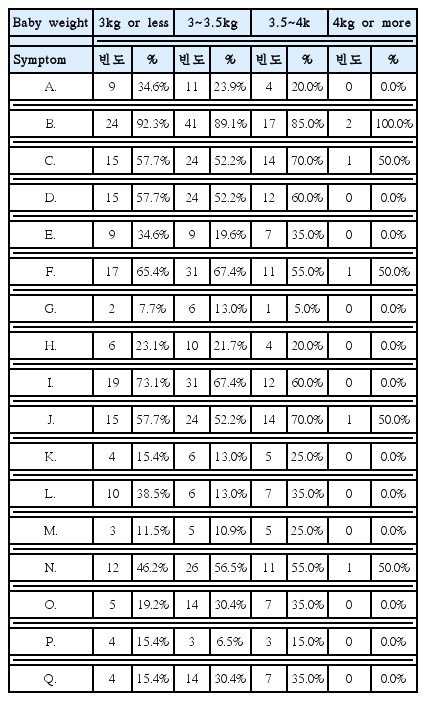
The Variance Analysis of Postpartum Symptoms Depending on the Babies’ Body Weight