Effect of Samhwangsasim-tang and Daehwanghwangryunsasim-tang on Palmitate-induced Lipogenesis in HepG2 cells
Article information
Abstract
Objectives:
The goal of this study was to investigate the anti-lipogenic effects of Samhwangsasim-tang(SHT), Daehwanghwangryunsasim-tang(DHT) aqueous extract on HepG2 cells with palmitate.
Materials and Methods:
HepG2 cells treated with palmitate were used in this study as hepatic steatosis model. Cells were treated with different concentrations of SHT, DHT aqueous extract for 24 hours. Cell viability and cytotoxicity were analyzed by MTT assay. Expressions of Bcl-2, Bax, Survivin, P21, TGF-β1, LXR-α, ChREBP, ACC1, SCD1 mRNA were determined by Real-time PCR. Apoptosis of cells was detected by ELISA and FACS. Expression level of caspase-3 was studied by Western blot. Lipid accumulation was indicated by Oil Red O staining.
Results:
SHT, DHT aqueous extract had no cytotoxicity, but decreased palmitate-induced lipid accumulation in HepG2 cells. SHT aqueous extract suppressed fatty acid synthesis by inhibiting LXR-α, ChREBP, SCD1 activation and increasing TGF-β1 expression level. DHT aqueous extract also suppressed fatty acid synthesis by decreasing ChREBP expression and increasing TGF-β1 expression. Apoptosis of lipid accumulated cells was increased by enhanced activities of P21, caspase-3 and inhibited expressions of Bcl-2, Survivin.
Conclusions:
These results suggest that SHT and DHT have an anti-lipogenic effects on lipid accumulation of hepatic cell. Also SHT and DHT have an efficacy to increase apoptosis of adipocyte without cytotoxicity. Therefore, SHT and DHT might have potential clinical applications for treatment of hepatic steatosis.
Cell viability assay. After treatment of Palmiticacid(PA) and SHT, DHT extract on HepG2 cells, MTT assay was performed. PA was treated as 100, 200, 300 μM for 24h. PA lowered viability of HepG2 cells. On the other hand, SHT, DHT extract(100, 200, 300 μg/ml) showed no toxicity to HepG2 cells(A). SHT, DHT extract increased viability of HepG2 cells treated with PA(B). Statistical significance was determined by one-way ANOVA test, #p<0.05, ##p<0.01 PA-treated group compared to control, *p<0.05, **p<0.01 SHT, DHT-treated group compared to control.
Bcl-2, Bax, Survivin, P21 mRNA Expression Level. PCR was performed with 1 μl of cDNA in 20 μl reaction mixtures that comprised 10 ml of Power SYBR Green PCR Master Mix, 2 μl of primers, and 7 μl of PCR-grade water. The reactions were performed with a denaturation step at 95°C for 10 min, 40 cycles of 95°C for 15 s, and 60°C for 1 min. The crossing point of the target genes with β-actin was calculated using the formula 2 (targetgene–ß actin), and the relative amounts were quantified. HepG2 cells were treated with 300 μM of PA and 0, 150, 300 μg/ml of SHT, DHT extract for 24 hours. Relative mRNA levels of Bcl-2(A), Bax(B), Survivin(C), P21(D) are represented on each bar graph. Statistical significance was determined by one-way ANOVA test.Also Bonferroni’s test and Student’s t-test were used to compare each set of data, #p<0.05, ##p<0.01 PA-treated group compared to control, *p<0.05, **p<0.01 SHT, DHT-treated group compared to PA-treated group.
SHT, DHT Extract Induced Apoptosis in HepG2 Cells. Apoptotic cells were detected by cell death detection ELISA kit(A)(B). Bar gragh shows relative gradient of apoptosis in SHT, DHT-treated groups compared to PA-treated group. Statistical significance was determined by one-way ANOVA test, #p<0.05, ##p<0.01 PA-treated group compared to control, *p<0.05, **p<0.01 SHT, DHT-treated group compared to PA-treated group.
FACS Histograms of Apoptosis Assays by Annexin V-FITC/PI Staining Method in HepG2 Cells. HepG2 cells were treated with 300 μM of PA and 0, 150, 300 μg/ml of SHT, DHT extract for 24 hours. The sums of proportion of early and late stage apoptotic cells are represented on each graph.
The Cleaved Form of Caspase-3 Expression Level. SHT, DHT extract both showed concentration dependent increase of expression level of caspase-3.
TGF-β1, LXR-α, ChREBP, ACC1, SCD1 mRNA Expression Level. HepG2 cells were treated with 300 μM of PA and 0, 150, 300 μg/ml of SHT, DHT extract for 24 hours. Relative mRNA levels of TGF-β1(A), LXR-α (B), ChREBP(C), ACC1(D), SCD1(E) are represented on each bar graph. Statistical significance was determined by one-way ANOVA test.Also Bonferroni’s test and Student’s t-test were used to compare each set of data, #p<0.05, ##p<0.01 PA-treated group compared to control, *p<0.05, **p<0.01 SHT, DHT-treated group compared to PA-treated group.
Oil Red O staining of HepG2 Cells. PA 300 μM for 24 h induced lipid accumulation in HepG2 cells. The cells were stained with Oil Red O and observed by microscope(×200): Control group cells were treated with only 1% BSA. Lipid accumulation was decreased in PA+SHT 150 μg/ml group, and the least lipid accumulation was observed in PA+SHT 300 μg/ml group(A). Also, lipid accumulation was lowered in PA+DHT 150 μg/ml group, and the least lipid accumulation is detected in PA+DHT 300 μg/ml group(B).
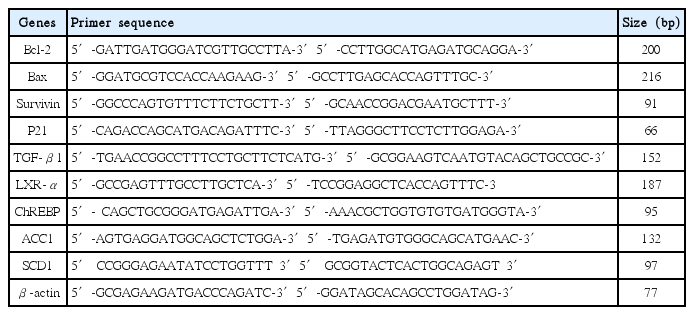
Primer Sequences for PCR.