The Influence of Pressure and Time on the Preparation of Gumiganghwal-tang Decoctions
Article information
Abstract
Objectives
This study compared Gumiganghwal-tang (GGT) decoctions produced using different pressure levels for various extraction times to determine the optimal extraction conditions through hydrogen ion concentration (pH), total soluble solids content (TSSC), extraction yield, and content of chemical compounds.
Methods:
Decoctions were prepared by the pressure levels of 0 or 1 kgf/cm2 for 30–180 min. The pH and TSSC were measured, the extraction yield was calculated, and the amounts of the chemical compounds were determined using high performance liquid chromatography.
Results:
The higher pressure and longer extraction time decreased the pH value, while those conditions increased TSSC and extraction yield: the decoction produced in 180 min by pressurized method showed the minimum value of pH, but maximum values of TSSC and extraction yield. The chemical compounds showed higher amounts in decoctions produced by non-pressurized methods than pressurized methods and their amounts were decreased over the peak extraction time in both pressurized and non-pressurized methods. The results of regression analysis confirmed the correlative influences of the pressure and extraction time on pH, TSSC, and extraction yield.
Conclusions:
This study suggests that pressure and extraction time influence the compositional constituents in GGT decoctions, and the non-pressurized method for 120 min should be chosen as the optimal extraction condition for the preparation of GGT decoction.
Introduction
Gumiganghwal-tang (GGT) is composed of twelve herbal medicines: Osterici Radix, Saposhnikoviae Radix, Cnidii Rhizoma, Angelicae Dahuricae Radix, Atractylodis Rhizoma, Scutellariae Radix, Rehmanniae Radix, Asari Radix et Rhizoma, Glycyrrhizae Radix et Rhizoma, Zingiberis Rhizoma Recens, Zizyphi Fructus, and Allii Fistulosi, and has been treated for symptoms such as chills, fever, headache, and stiffness of neck and upper back caused by the common cold1). GGT is ranked fifth out of 56 formulas in terms of medicated days and medical expenses by Oriental Health Treatment, marking it as one of the most frequently used in Korean medical institutes2).
The decoction of herbal formula has been prepared by boiling herbs or plant materials with water for a suitable extraction time. Extraction factors such as temperature, time, or pressure can influence the ingredients in herbal formulae because most herbal decoctions are produced by a heating process. Previous studies have demonstrated the influence of extraction time or pressure on the extraction yield of chemical compounds from herbal medicines3,4). However, whether the extraction factors such as pressure or extraction time affect the compositional changes of the herbal decoction has not been previously investigated.
In the present study, the GGT decoctions were prepared by using pressurized or non-pressurized extraction methods for different extraction times from 30 min to 180 min while the temperature was kept at 100°C. The extraction variables such as hydrogen ion concentration (pH), total soluble solids content (TSSC), and extraction yield were investigated, and the contents of chemical compounds were determined using high performance liquid chromatography coupled with diode-array detection. Regression analysis was performed to confirm the interaction between extraction factors and extraction variables in decoctions, based on which the optimal conditions for the extraction of herbal formula were explored.
Materials and Methods
1. Reagents and herbal materials
HPLC-grade acetonitrile and water were purchased from J. T. Baker Inc. (Phillipsburg, NJ, USA) and acetic acid (GR grade) was obtained from Junsei (Tokyo, Japan). Liquiritin, baicalin, and glycyrrhizin were purchased from Wako Pure Chemical Industries Ltd. (Osaka, Japan). The purities of marker compounds were > 98% and their chemical structures are shown in Fig. 1.

Chemical structures of standard compounds in Gumiganghwal-tang (GGT).
The herbal medicines were purchased from the herbal medicine company Kwangmyungdang Medicinal Herbs (Ulsan, Korea). A voucher specimen (2013-KE16-112) has been deposited in the Herbal Medicine Formulation Research Group of the Korea Institute of Oriental Medicine.
2. Preparation of standard solutions
Accurately weighed compounds were dissolved in methanol to make stock solutions at concentrations of 1 mg/mL. Each stock solution was diluted to produce working solutions, and then the calibration curves were constructed using the working solutions.
3. Preparation of GGT decoctions
The mixture of herbal medicines of GGT (975 g corresponding to one formula set, ‘Je’ in Korean) was extracted at 100°C in water using a high-speed vacuum herb extractor (Cosmos 660, Kyungseo Machine, Incheon, Korea). The extraction was carried out under pressurized (1.0 kgf/cm2) or non-pressurized (0 kgf/cm2) methods for 30, 60, 90, 120, 150, and 180 min. The extraction water was regulated to make the final volumes of the decoctions around 3800 mL. 70 mL of each decoction was lyophilized using a freeze-drier (IlshinBioBase, Dongducheon, Korea) to make a powder.
4. Measurements of hydrogen ion concentration (pH), total soluble solids content (TSSC), and extraction yield
pH was determined with a pH meter (672 pH/Ion meter; Metrohm, Switzerland). TSSC (°Brix) of each decoction was measured using a refractometer (Pal-α; ATAGO, Tokyo, Japan).
The weight of each freeze-dried decoction was converted to a percentage of the formula used for a single extraction to calculate the extraction yield of decoctions.
5. Chromatographic conditions
Chemical analysis was performed using an HPLC system (LC-20A; Shimadzu, Japan) equipped with a solvent delivery unit, autosampler, column oven, photodiode array detector, and degasser. The data were processed using the LabSolutions software (Ver. 5.3; Shimadzu, Japan). The marker compounds were separated on a Gemini C18 column (4.6 mm × 250 mm, 5 μm; Phenomenex, USA) at 40°C. The flow rate was set at 1.0 mL/min, and the injection volume was 10 μL. The mobile phase consisted of water (A) and acetonitrile (B), both containing 1.0% acetic acid, with following elution gradient: 0–40 min, 5–70% B; 40–45 min, 70–100% B, held for 5 min, and then re-equilibrating to 5% until the end of analysis. Detection wavelengths were set at its maximum wavelength in the UV spectrum (254 and 280 nm).
6. Statistical analysis
All experiments were run in triplicate. Two-tailed t-tests were conducted for the two-group comparisons in SYSTAT 10 (SPSS Inc., Chicago, IL, USA). Differences were considered significant at p < 0.05, p < 0.01, or p < 0.001. Regression analysis on the interaction of the pressure and extraction time was performed through pH, TSSC, extraction yields, and the sum of content ratio using open source software ‘R (ver. 2.15.1)’.
Results
1. Comparison of pH, TSSC, and extraction yield in GGT decoctions
There was no significant difference of the hydrogen ion concentration (pH) between the pressurized and non-pressurized decoctions until 60 min, but significantly lower pH was observed in decoctions produced by the pressurized method after 90 min. As the extraction time increased, the pH decreased in the decoctions produced by both extraction methods (Fig. 2A).
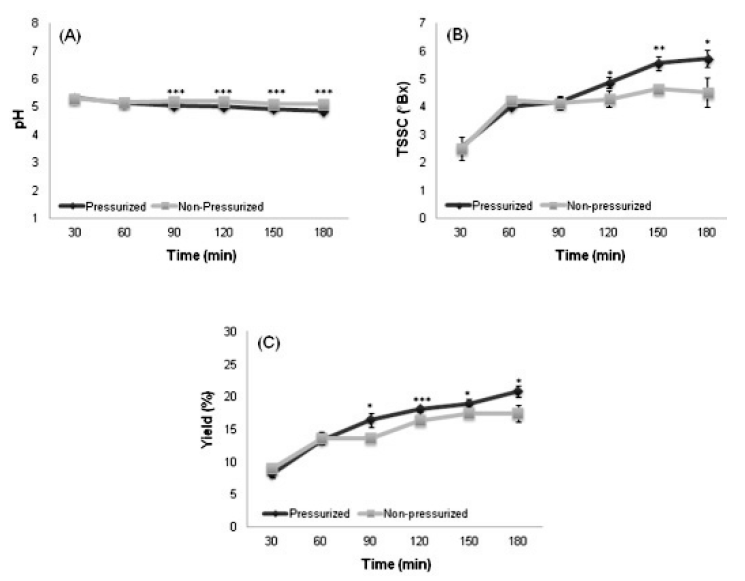
Variation of hydrogen ion concentration (A), total soluble solids content (B), and extraction yield (C) in decoctions produced by different pressure and times. Data expressed as average of triplicate measurements. Statistically significant at *p<0.05, **p<0.01 or ***p<0.001 of difference in values between pressurized and non-pressurized extraction methods.
The values of total soluble solids content (TSSC) and extraction yield showed similar patterns. After 90 or 120 min, significant difference was found in TSSC and extraction yield between the pressurized and non-pressurized decoctions: the decoction produced by pressurized method showed higher TSSC and extraction yield, which both increased with increasing extraction time as a whole (Fig. 2B and 2C).
2. Linear equation, coefficient of determination (r2), LOD and LOQ
The coefficient of determination of 3 marker compounds ranged from 0.9998 to 1.0000, which means good linearity within the linear range. The limit of detection (LODs) and the limit of quantification (LOQs) of compounds were calculated based on the equation: 3.3*SD/S and 10*SD/S, respectively, where SD is the standard deviation of response and S is the slope of the regression equations. The LODs and LOQs ranged from 0.02–0.11 g/mL and 0.07–0.37 g/mL, respectively (Table 2). The marker compounds were well separated and selective without any interference on the chromatogram (Fig. 3).

Regression Equation, Coefficient of Determination (r2), Linear range, LOD, and LOQ of Standard Compounds
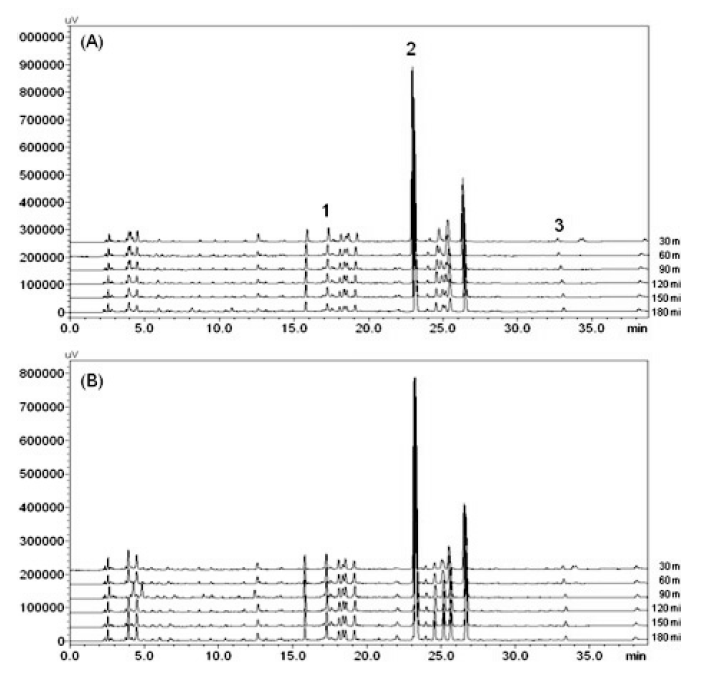
Representative chromatograms of GGT decoctions produced by the pressurized extraction method (A) and the non-pressurized extraction method (B). 1, liquiritin; 2, balicalin; 3, glycyrrhizin.
3. Comparison of the contents of the marker compounds in GGT decoctions
The non-pressurized method produced significantly higher content of liquiritin for all of the extraction times and the contents showed peaks at 60 min in the decoctions produced by both methods. The contents of liquiritin in both pressurized and non-pressurized methods slightly decreased with increasing extraction time (Fig. 4A). Baicalin showed the most predominant content among the three marker compounds and was also higher in the decoction produced by the non-pressurized method. Peak amounts were observed at 120 min for the non-pressurized method and 90 min for pressurized, respectively, and then the contents decreased past the peak extraction times (Fig. 4B). The content of glycyrrhizin was also observed at a significantly higher value in the non-pressurized method except for at 90 and 180 min. Unlike the results of liquiritin and baicalin, the peak content of glycyrrhizin was found at 120 min for the non-pressurized method and 180 min for pressurized, which showed increasing tendency as extraction time increased (Fig. 3C). The sum of content ratio indicated the peak amounts of compounds at 120 min for the non-pressurized method and 90 min for pressurized (Fig. 4D).

Variation of the content of 3 marker compounds, liquiritin (A), baicalin (B), and glycyrrhizin (C), and the sum of content ratio (D). Data expressed as average of triplicate measurements. Statistically significant at *p<0.05, **p<0.01 or ***p<0.001 of difference in values between pressurized and non-pressurized extraction methods. †Content ratio = the content of compound produced in each extraction time (from 60 min to 180 min)/the content of compound produced in 30 min.
4. Regression analysis of the influence of the pressure and extraction on pH, TSSC, extraction yield, and sum of content ratio
Regression analysis was performed to find out the relationship between 4 variables (pH, TSSC, extraction yield, and sum of content ratio) and extraction factors (pressure and extraction time). The pH, TSSC, and extraction yield showed adjusted regression coefficients (R2adj) more than 0.7 with significant F- and p-values whereas sum of content ratio exhibited R2adj value less than 0.1 without any significant F- and p-values (Table 3).
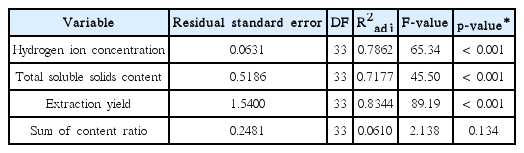
Regression Analysis of Extraction Factors (pressure and extraction time) on 4 Variables (hydrogen ion concentration, total soluble solids content, and sum of content ratio)
Discussions
In the present study, we investigated the influences of extraction factors (pressure and extraction time) to variables such as hydrogen ion concentration (pH), total soluble solids content, extraction yield, and the content of chemical compounds in GGT decoction while the temperature was maintained at 100°C.
The pH undergoes a variation in the process of extraction and is influenced by the extraction parameters such as extraction time or pressure. Longer extraction time and higher pressure decrease pH because of the higher release of phenolics into the solvent as well as the deprotonation of molecules present in the extracts; reduced pH might enhance the extraction of bioactive compounds stable at lower pH5,6).
Pressure and extraction time also played a significant role in producing the ingredient from the decoctions as shown in the results of TSSC and extraction yield. The TSSC that consists of sugars, salts, proteins, and acids varies with the extraction solvent, the extraction time, and the temperature7,8). The extraction yield as well as TSSC is affected by the extraction pressure and time, which means higher pressure and longer extraction time can improve the solvent power to penetrate into and break down the plant tissue cells, and consequently, ingredients could be more effectively extracted from the plant cells, and an enhanced mass transfer rate increases the cell permeability and secondary metabolite diffusion9,10).
Unlike the results from pH, TSSC, and extraction yield, the content of marker compounds did not show any proportional influence by the pressure and extraction time. Rather, the non-pressurized method produced higher values of each compound and the peak time when the content was highest could be observed. These findings indicate that the higher extraction pressure and longer extraction time might degrade or decompose the chemical compounds in the decoction, or have impurities over-extracted from the herbs, which reduced the relative amount of chemical compound11). The sum of 3 marker compounds was represented as the sum of content ratio, which means the content of compound produced in each extraction time (from 60 min to 180 min) divided by the content of compound produced in 30 min, to avoid the influence of the compound with considerably higher content and extraction yield. The 60 min for the pressurized method and 120 min for the non-pressurized method can be considered as maximum content of chemical compounds.
The results obtained from regression analysis demonstrate the relationship between extraction factors (pressure and extraction time) and variables such as pH, TSSC, extraction yield, and the sum of content ratio. Correlation coefficients > 0.7 in pH, TSSC, and extraction yield explain that the pressure and extraction time can affect the productions of those variables because the coefficient value the closer to 1 means better correlation between the variables and extraction factors with their statistical significances at greater F-value and smaller p-value12, 13). These findings suggest that higher pressures and longer extraction time can positively influence the pH, TSSC, and extraction yield that can be considered as extraction efficiency, but have a negative effect on the extraction of chemical compounds in GGT decoction.
Conclusions
In the present study, the comparison of GGT decoctions produced by different extraction pressure (0 and 1 kgf/cm2) and time (30180 min) was performed through pH, TSSC, extraction yield, and the content of chemical compounds. The pressure and extraction time affected the extraction efficiency of GGT decoctions; the physicochemical properties are thought to be optimal in decoctions produced by the non-pressurized method for 120 min.
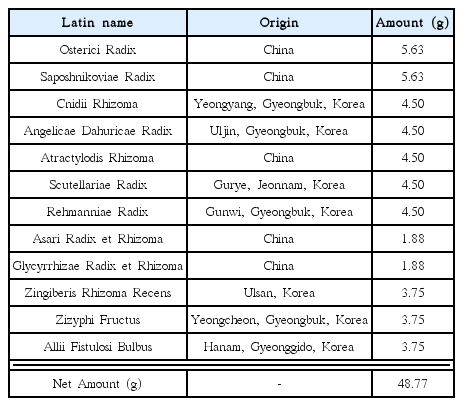
Composition of Medicinal Herbs in Gumiganghwal-tang (GGT)
Acknowledgements
This work was supported by a grant from the Korea Institute of Oriental Medicine (K13030).