Effects of Bogijetong-Tang on Diabetic-peripheral Neuropathy Induced by Streptozotocin in the Mouse
Article information
Abstract
Objectives:
Previous reports have shown that Bogijetong-Tang (BJT) is effective in peripheral neuropathy induced by taxol and crush injury. In this study, we researched the effects of BJT on diabetic neuropathy induced by STZ in the mouse.
Methods:
We performed both in vitro and in vivo experiments to verify the effects of BJT on diabetic neuropathy induced by STZ in mice. Changes in axonal recovery were observed with immunofluorescence staining using NF-200, Hoechst33258, S100β, caspase 3 and anti-cdc2. Proliferation and degeneration of Schwann cells were investigated by immunofluorescence staining and western blot analyses.
Results:
BJT showed considerable effects on neurite outgrowth and axonal regeneration in diabetic neuropathy. BJT contributed to the creation of NF-200, GAP-43, Cdc2, phosphovimentin, β1, active β1, β3 integrin, phospho-Erk1/2 protein.
Conclusions:
Through this study, we found that BJT is effective for enhanced axonal regeneration via dynamic regulation of regeneration-associated proteins. Therefore, BJT had a pharmaceutical property enhancing recovery of peripheral nerves induced by diabetic neuropathy and could be a candidate for drug development after more research.
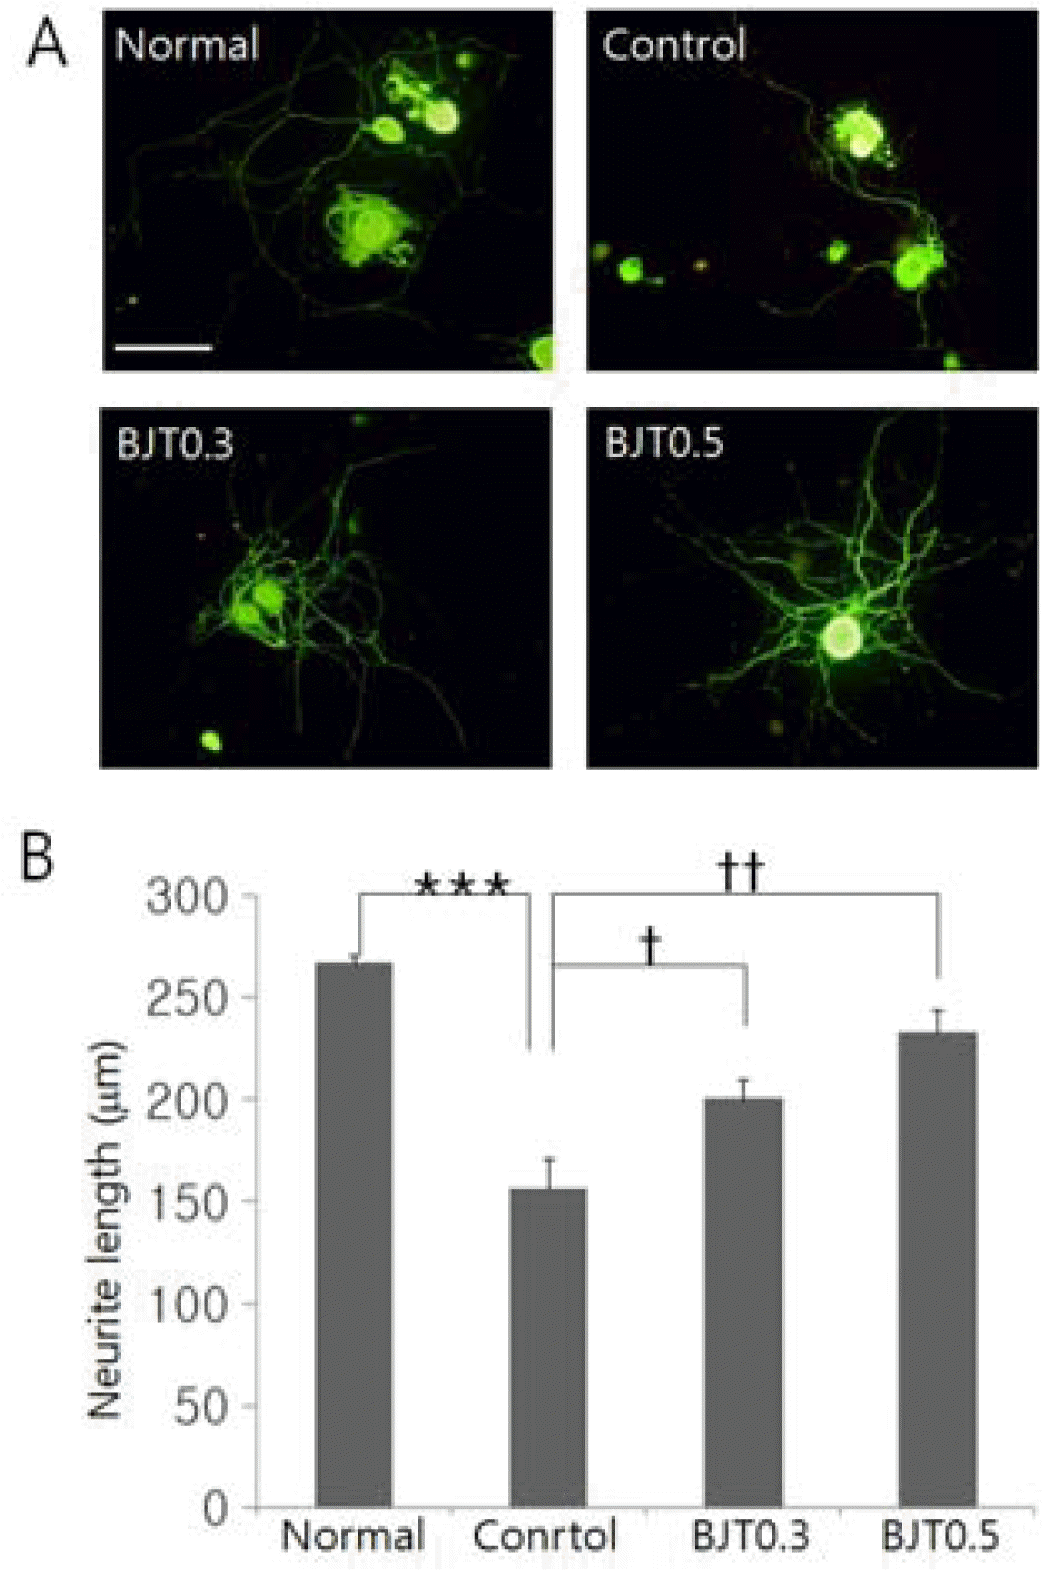
Pattern of neurite outgrowth of cultured DRG neurons.
DRG sensory neurons were treated with glucose and BJT at 0.3mg/ml or 0.5mg/ml for 24hr. Cells were visualized by immunofluorescence staining for NF-200 protein (blue). (A) Representative images of immunostained cells. (B) Quantification of neurite outgrowth. n=4 ***:p<0.001 (vs normal group) †: p<0.05, ††: p<0.01 (vs control group). Scale bar in (A): 50μm.
Normal : non-treated group.
Control : glucose(30mM) + saline
BJT0.3 : glucose(30mM) + BJT(0.3mg/ml)
BJT0.5 : glucose(30mM) + BJT(0.5mg/ml)
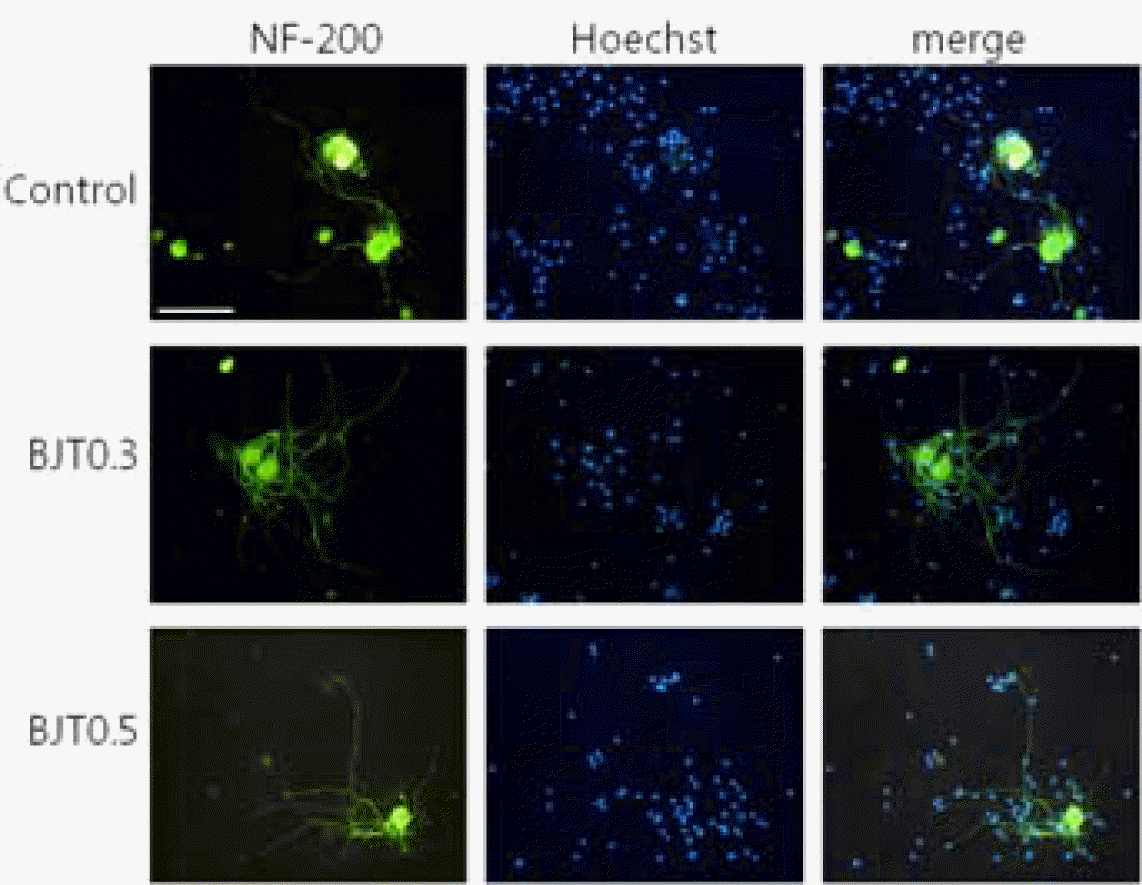
Distribution of DRG neurons and non-neuronal cells of cultured DRG tissue.
Cultured DRG cells including sensory neurons and non-neuronal cells were identified by NF-200 immunostaining (green) and Hoechst nuclear staining (blue). Merged images show their proximity in distribution in culture. Scale bar: 50μm.
Control : glucose(30mM) + saline
BJT0.3 : glucose(30mM) + BJT(0.3mg/ml)
BJT0.5 : glucose(30mM) + BJT(0.5mg/ml)
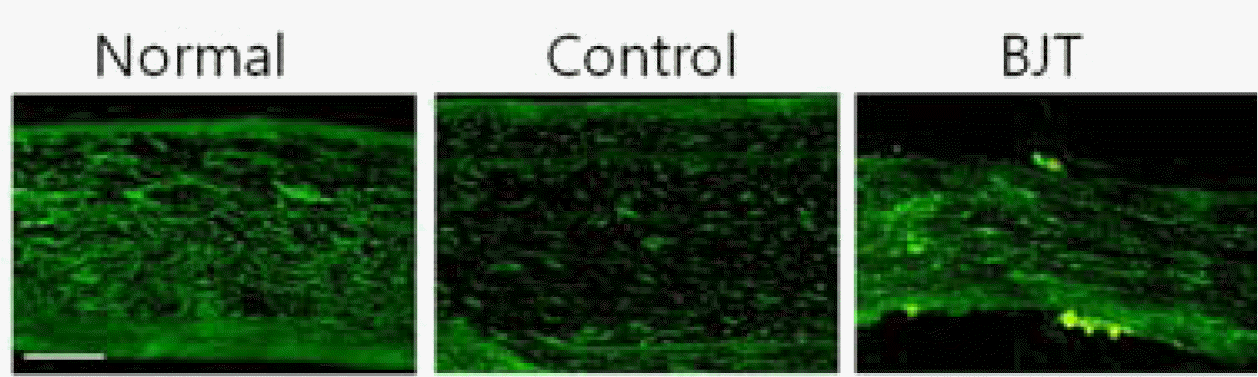
Immunofluorescence staining analysis of NF-200 protein signals in the longitudinal sciatic nerve sections.
Following treatments of STZ and BJT, sciatic nerve sections were used for immunofluorescence staining for NF-200 protein (in green).
Scale bar: 200μm.
Normal : non-treated group.
Control : STZ(200mg/kg) + saline
BJT : STZ(200mg/kg) + BJT(400mg/kg)
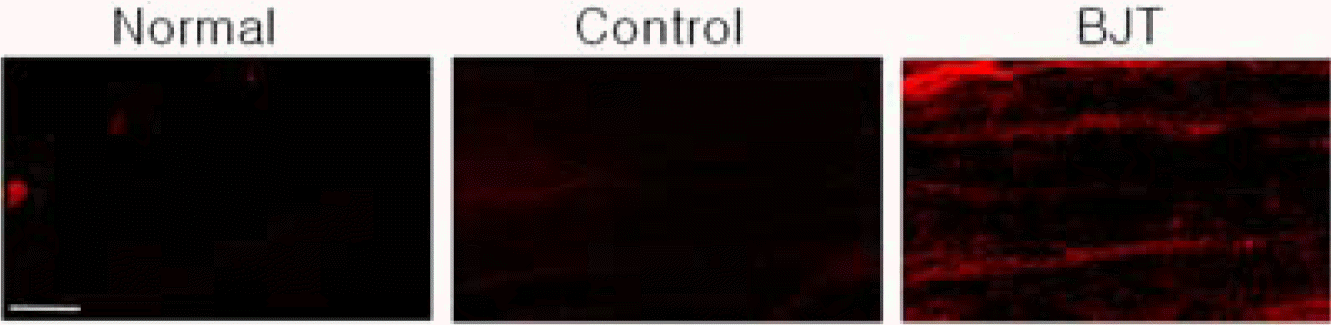
Immunofluorescence staining analysis of GAP-43 protein signals in the longitudinal sciatic nerve sections.
Following treatments of STZ and BJT, sciatic nerve sections were used for immunofluorescence staining for GAP-43 protein (in red).
Scale bar: 200μm.
Normal : non-treated group.
Control : STZ(200mg/kg) + saline
BJT : STZ(200mg/kg) + BJT(400mg/kg)
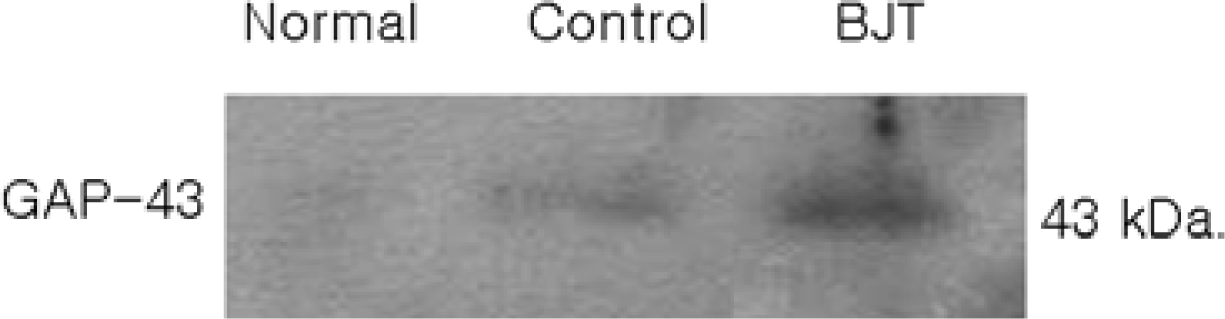
Western blot analysis of GAP-43 in protein samples from the sciatic nerves after different treatments.
GAP-43 protein was identified as a single band at 43 kDa.
Normal : non-treated group.
Control : STZ(200mg/kg) + saline
BJT : STZ(200mg/kg) + BJT(400mg/kg)
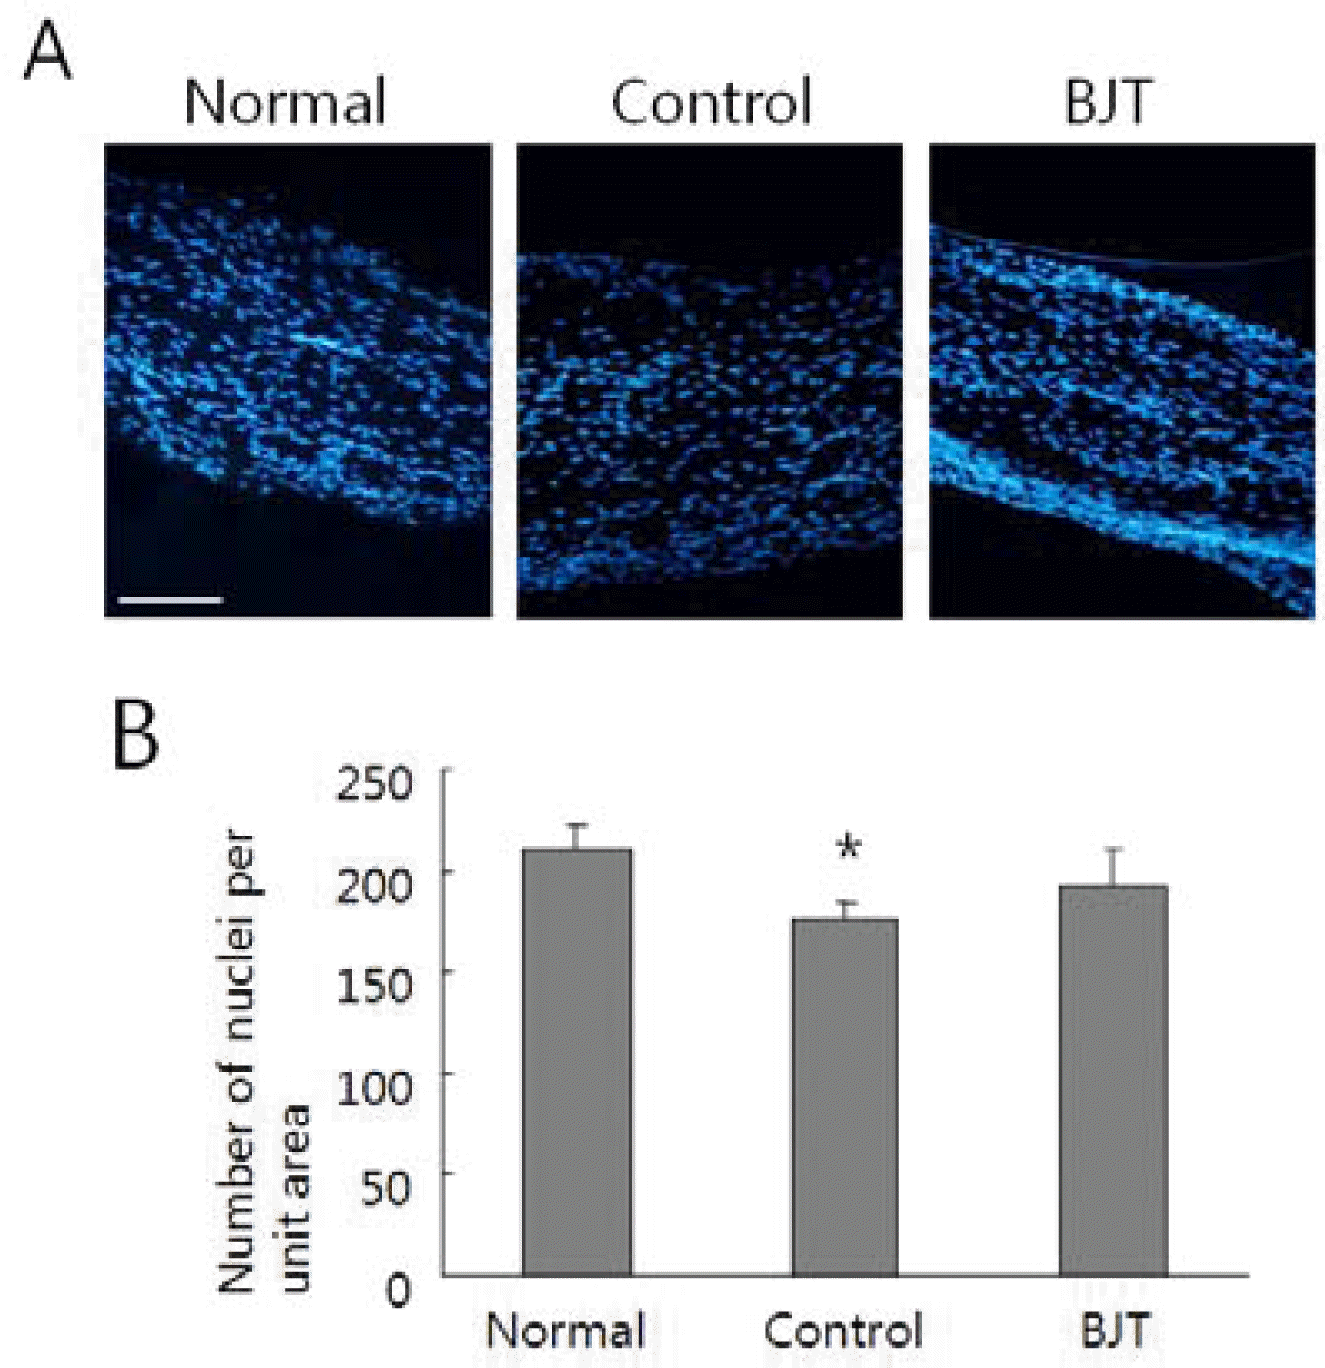
Hoechst nuclear staining of sciatic nerve sections. Longitudinal nerve sections were used for Hoechst nuclear staining, and individual nuclei were detected (in blue).
(A) Representative images in nerve sections for individual experimental groups. (B) Quantitative comparison of the number of nuclei among individual experimental groups. n=4, error bar: SEM. *P<0.05, compared to normal group. Scale bar in (A): 200μm.
Normal : non-treated group.
Control : STZ(200mg/kg) + saline
BJT : STZ(200mg/kg) + BJT(400mg/kg)
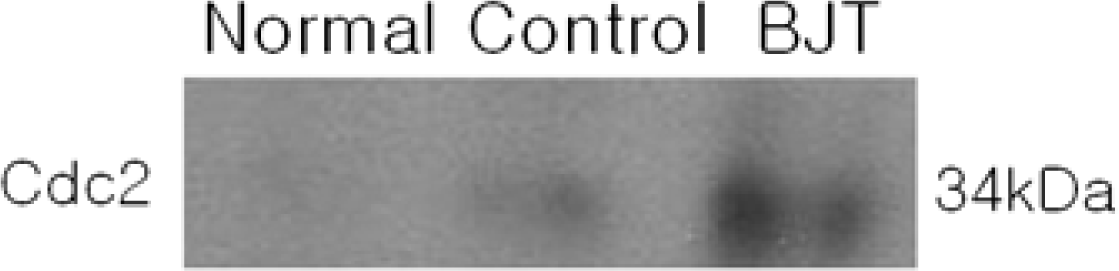
Western blot analysis of Cdc2 in protein samples from the sciatic nerves after different treatments.
Cdc2 protein was identified as a single band at 34 kDa.
Normal : non-treated group.
Control : STZ(200mg/kg) + saline
BJT : STZ(200mg/kg) + BJT(400mg/kg)
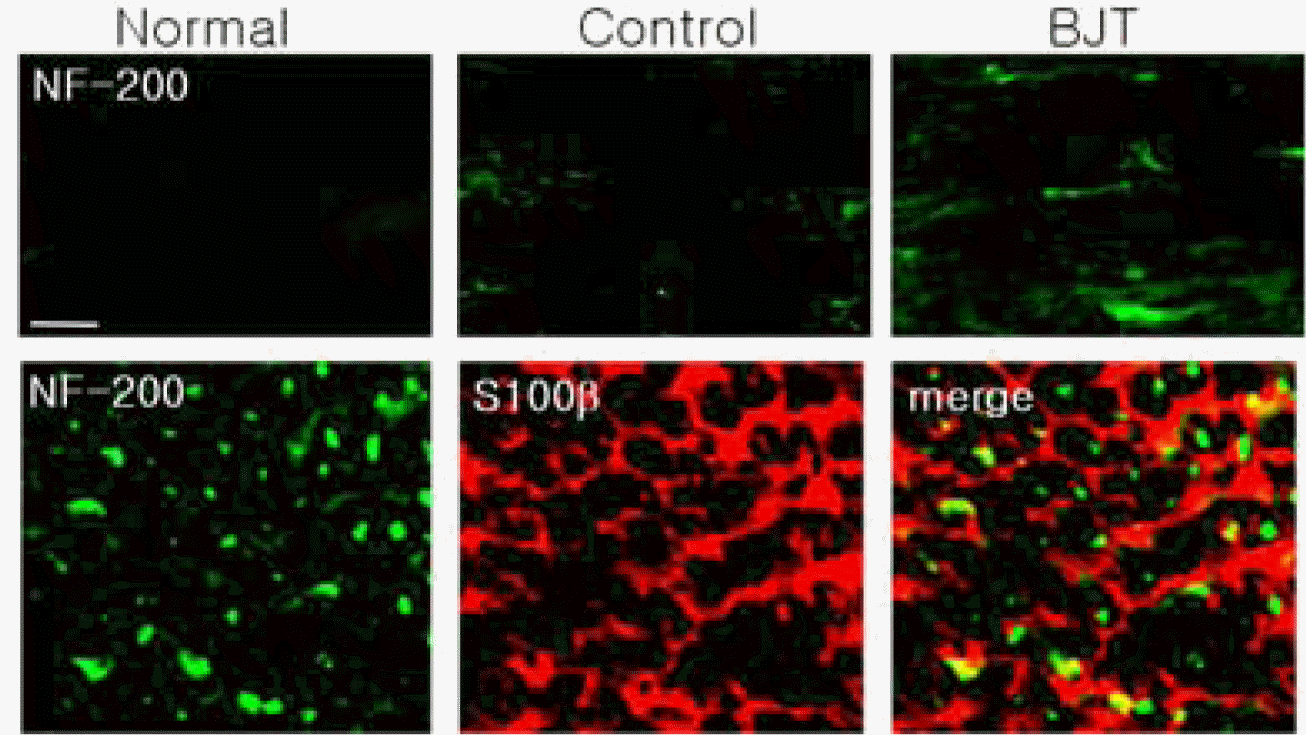
Immunofluorescence staining analysis of Cdc2 protein signals in the longitudinal sciatic nerve sections.
Following treatments of STZ and BJT, sciatic nerve sections were used for immunofluorescence staining. (A) Representative fluorescence views for NF-200 protein (green). (B) Double immunofluorescence staining of Cdc2 and S100 β protein signals. Transverse nerve sections from the injured sciatic nerves were used to examine colocalization of two proteins. Scale bars in (A) and (B): 100μm.
Normal : non-treated group.
Control : STZ(200mg/kg) + saline
BJT : STZ(200mg/kg) + BJT(400mg/kg)
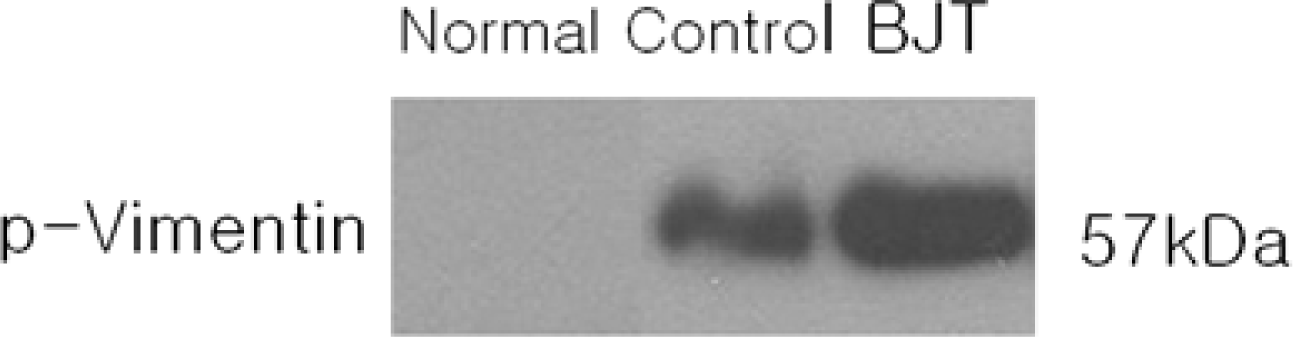
Western blot analysis of phospho-vimentin in protein samples from the sciatic nerves after different treatments. Phospho-vimentin was identified as a single band at 57 kDa.
Normal : non-treated group.
Control : STZ(200mg/kg) + saline
BJT : STZ(200mg/kg) + BJT(400mg/kg)
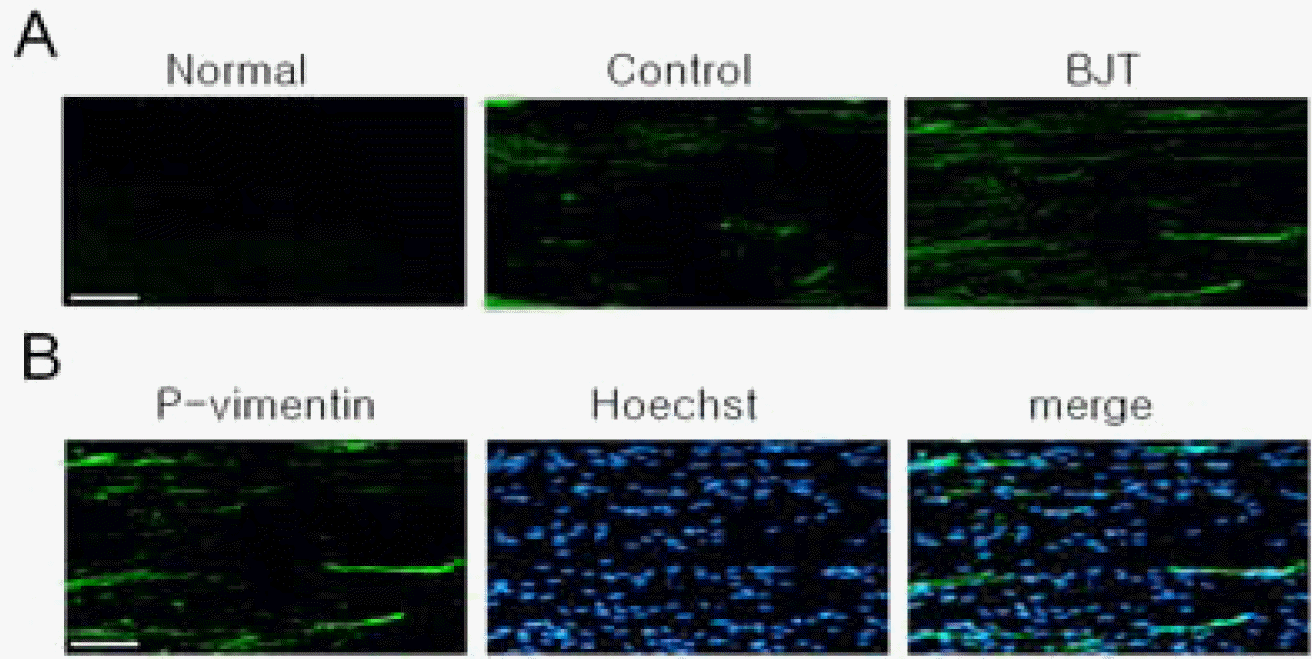
Immunofluorescence staining analysis of phospho-vimentin signals in the longitudinal sciatic nerve sections.
Following treatments of STZ and BJT, sciatic nerve sections were used for immunofluorescence staining for phospho-vimentin (in green). (A) Representative fluorescence staining images. (B) Merged images of phospho-vimentin with Hoechst-stained nuclei. Scale bar in (A, B): 100μm.
Normal : non-treated group.
Control : STZ(200mg/kg) + saline
BJT : STZ(200mg/kg) + BJT(400mg/kg)
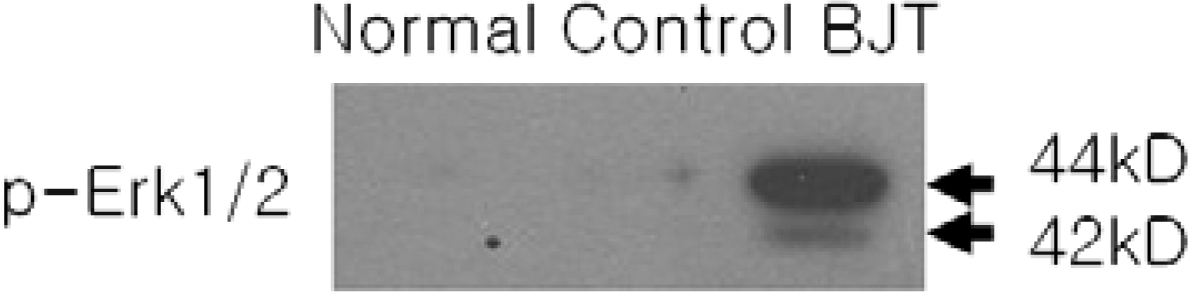
Western blot analysis of phospho-Erk1/2 in protein samples from the sciatic nerves after different treatments
Phospho-Erk1/2 was identified as double bands at 42 and 44kDa (arrows).
Normal : non-treated group.
Control : STZ(200mg/kg) + saline
BJT : STZ(200mg/kg) + BJT(400mg/kg)
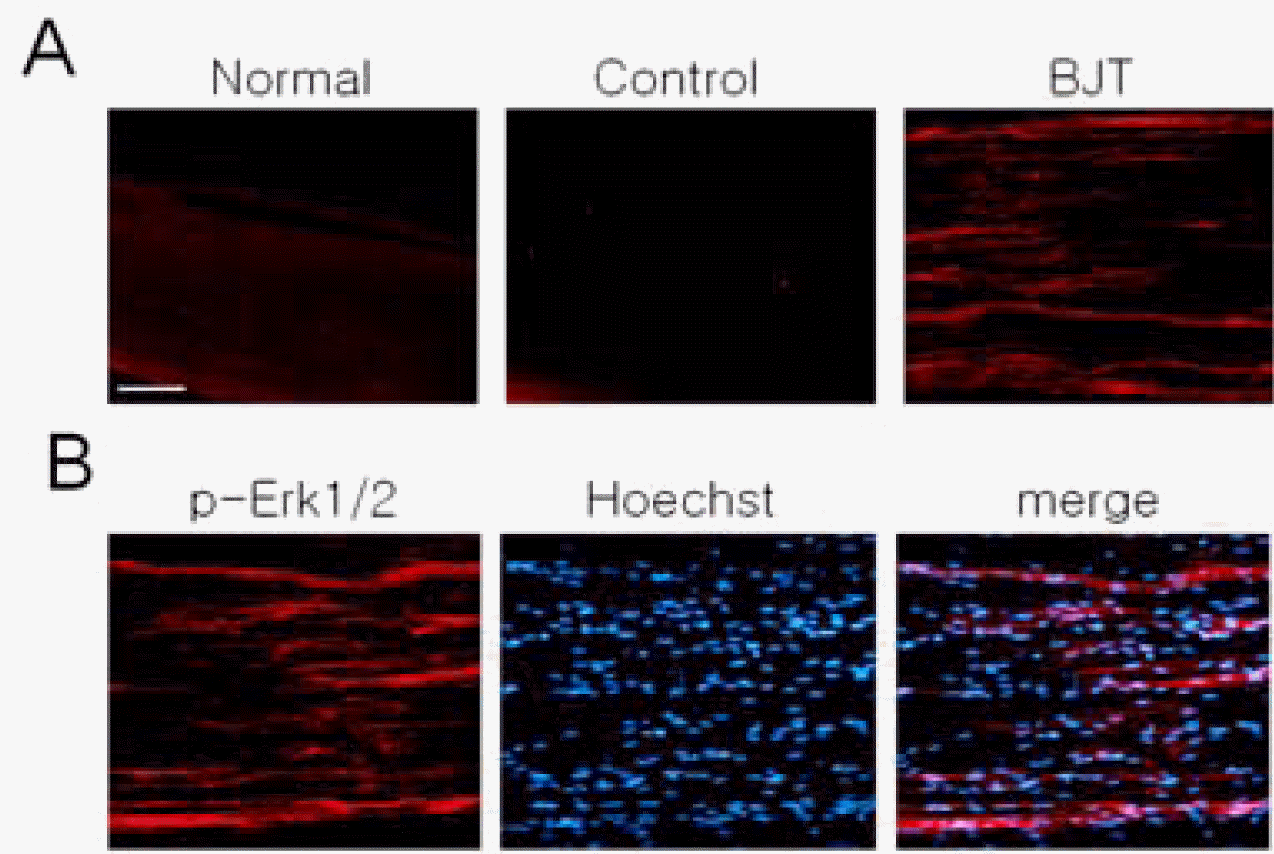
Immunofluorescence staining analysis of phospho-Erk1/2 signals in the longitudinal sciatic nerve sections
Following treatments of STZ and BJT, sciatic nerve sections were used for immunofluorescence staining for phospho-Erk1/2 (in red). (A) Representative fluorescence staining images. (B) Merged images of phospho-Erk1/2 with Hoechst-stained nuclei.
Scale bar in (A): 100μm, which also applies to (B).
Normal : non-treated group.
Control : STZ(200mg/kg) + saline
BJT : STZ(200mg/kg) + BJT(400mg/kg)
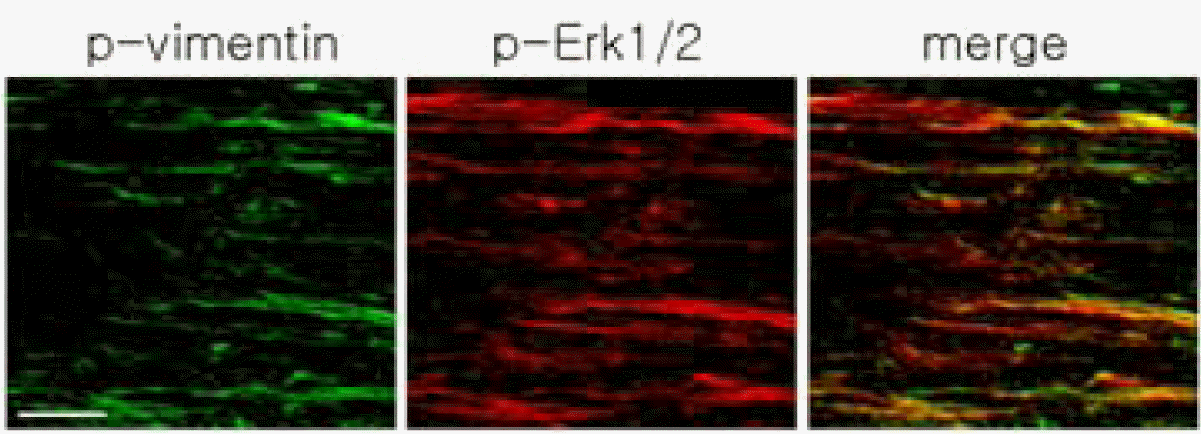
Double Immunofluorescence staining of phospho-Erk1/2 (red) and phospho-vimentin (green).
The images shown here are prepared from the nerve of the animal treated with both STZ and BJT. Scale bar: 100μm.
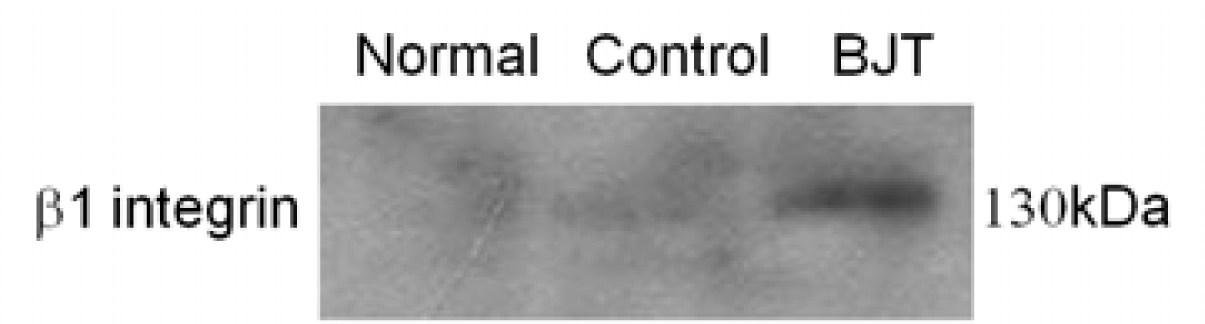
Western blot analysis of β1 integrin in protein samples from the sciatic nerves after different treatments.
β1 integrin was identified as double bands at 130 kDa.
Normal : non-treated group.
Control : STZ(200mg/kg) + saline
BJT : STZ(200mg/kg) + BJT(400mg/kg)
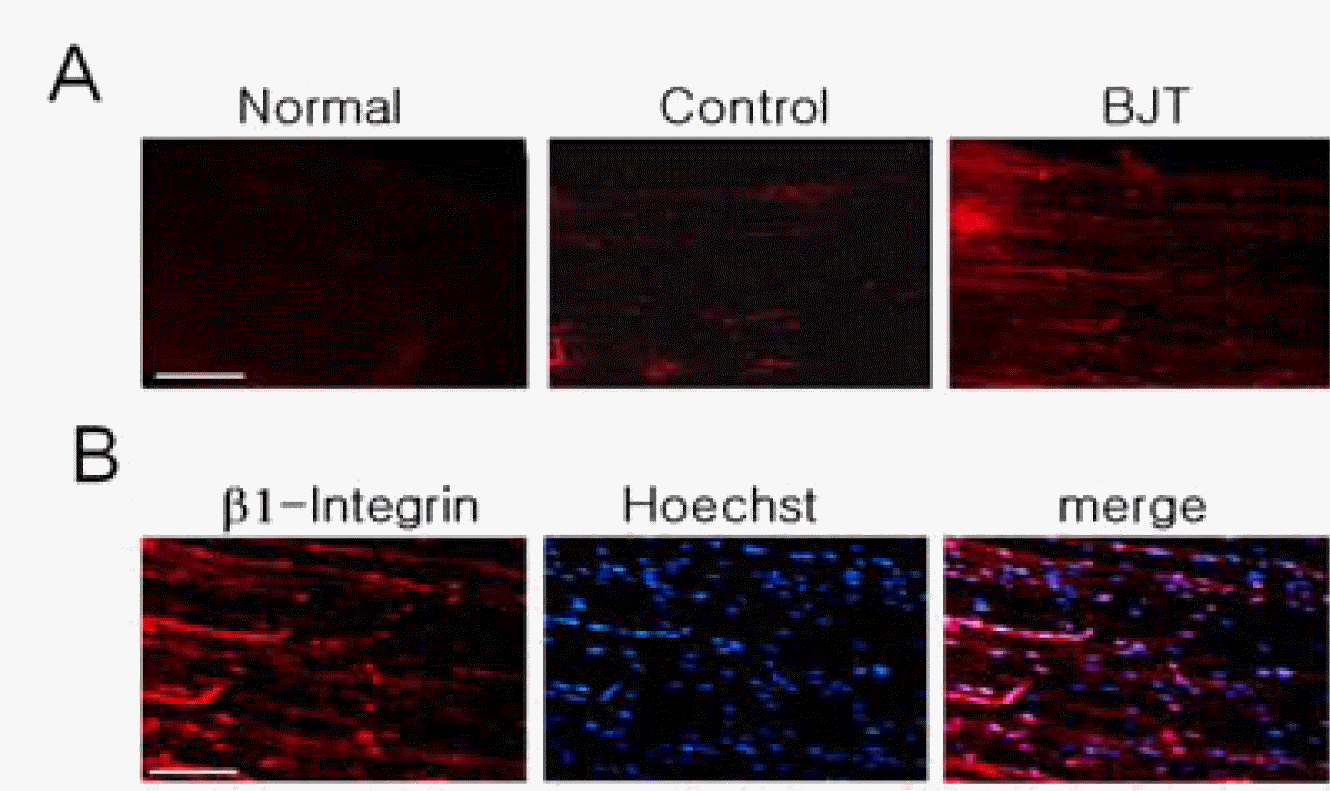
Immunofluorescence staining analysis of β1 integrin signals in the longitudinal sciatic nerve sections.
Following treatments of STZ and BJT, sciatic nerve sections were used for immunofluorescence staining for β1 integrin (in red). (A) Representative fluorescence staining images. (B) Merged images of β1 integrin with Hoechst-stained nuclei. Scale bar in (A, B): 100μm.
Normal : non-treated group.
Control : STZ(200mg/kg) + saline
BJT : STZ(200mg/kg) + BJT(400mg/kg)
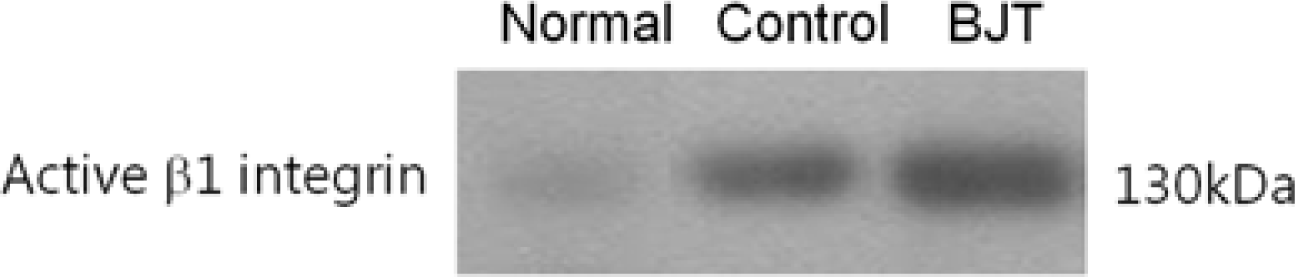
Western blot analysis of active β1 integrin in protein samples from the sciatic nerves after different treatments.
Active β1 integrin was identified as double bands at 130 kDa.
Normal : non-treated group.
Control : STZ(200mg/kg) + saline
BJT : STZ(200mg/kg) + BJT(400mg/kg)
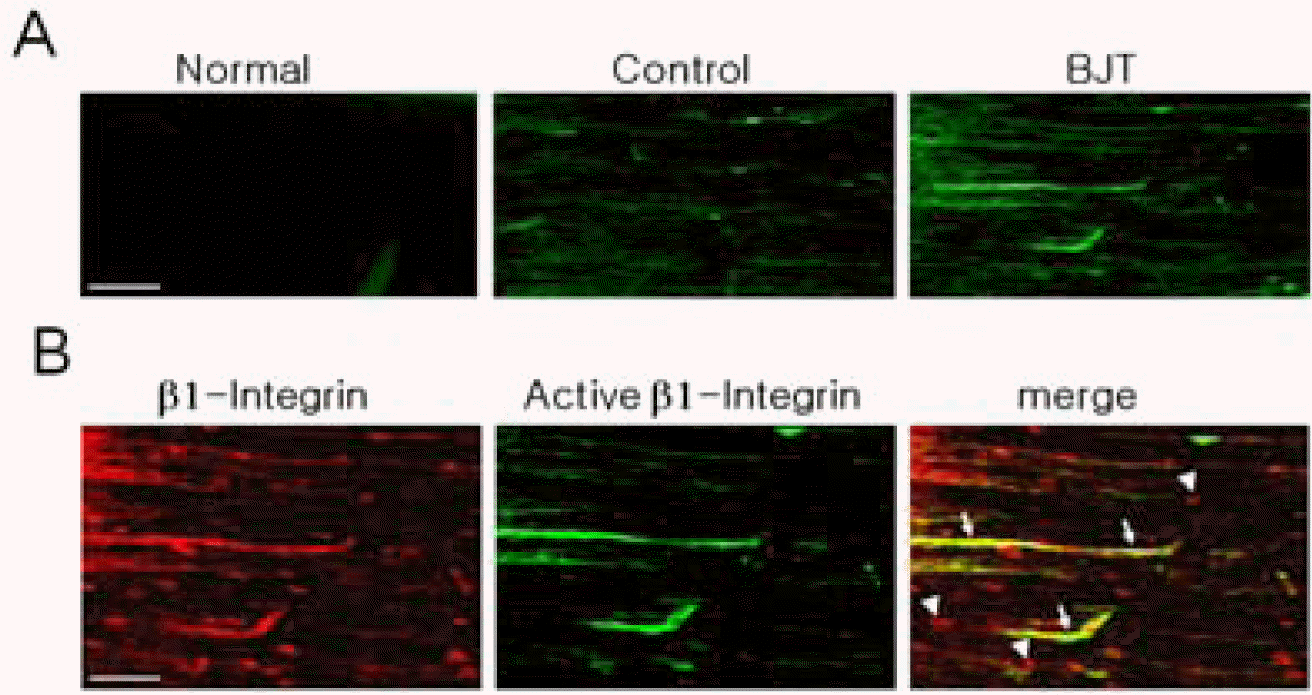
Immunofluorescence staining analysis of active form of β1 integrin signals in the longitudinal sciatic nerve sections.
Following treatments of STZ and BJT, sciatic nerve sections were used for immunofluorescence staining for active β1 integrin (in green). (A) Representative fluorescence staining images. (B) Double immunofluorescence staining of the nerves treated with STZ and BJT with total (red) and active β1 integrin proteins (green). Scale bar in (A, B): 100μm.
Normal : non-treated group.
Control : STZ(200mg/kg) + saline
BJT : STZ(200mg/kg) + BJT(400mg/kg)
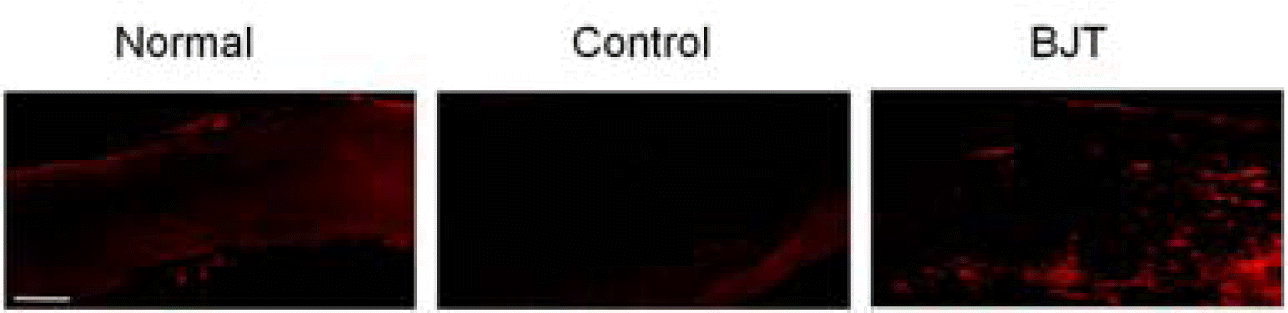
Immunofluorescence staining analysis of β 3 integrin signals in the longitudinal sciatic nerve sections.
Following treatments of STZ and BJT, sciatic nerve sections were used for immunofluorescence staining for β3 integrin (in red). Scale bar: 200μm.
Normal : non-treated group.
Control : STZ(200mg/kg) + saline
BJT : STZ(200mg/kg) + BJT(400mg/kg)
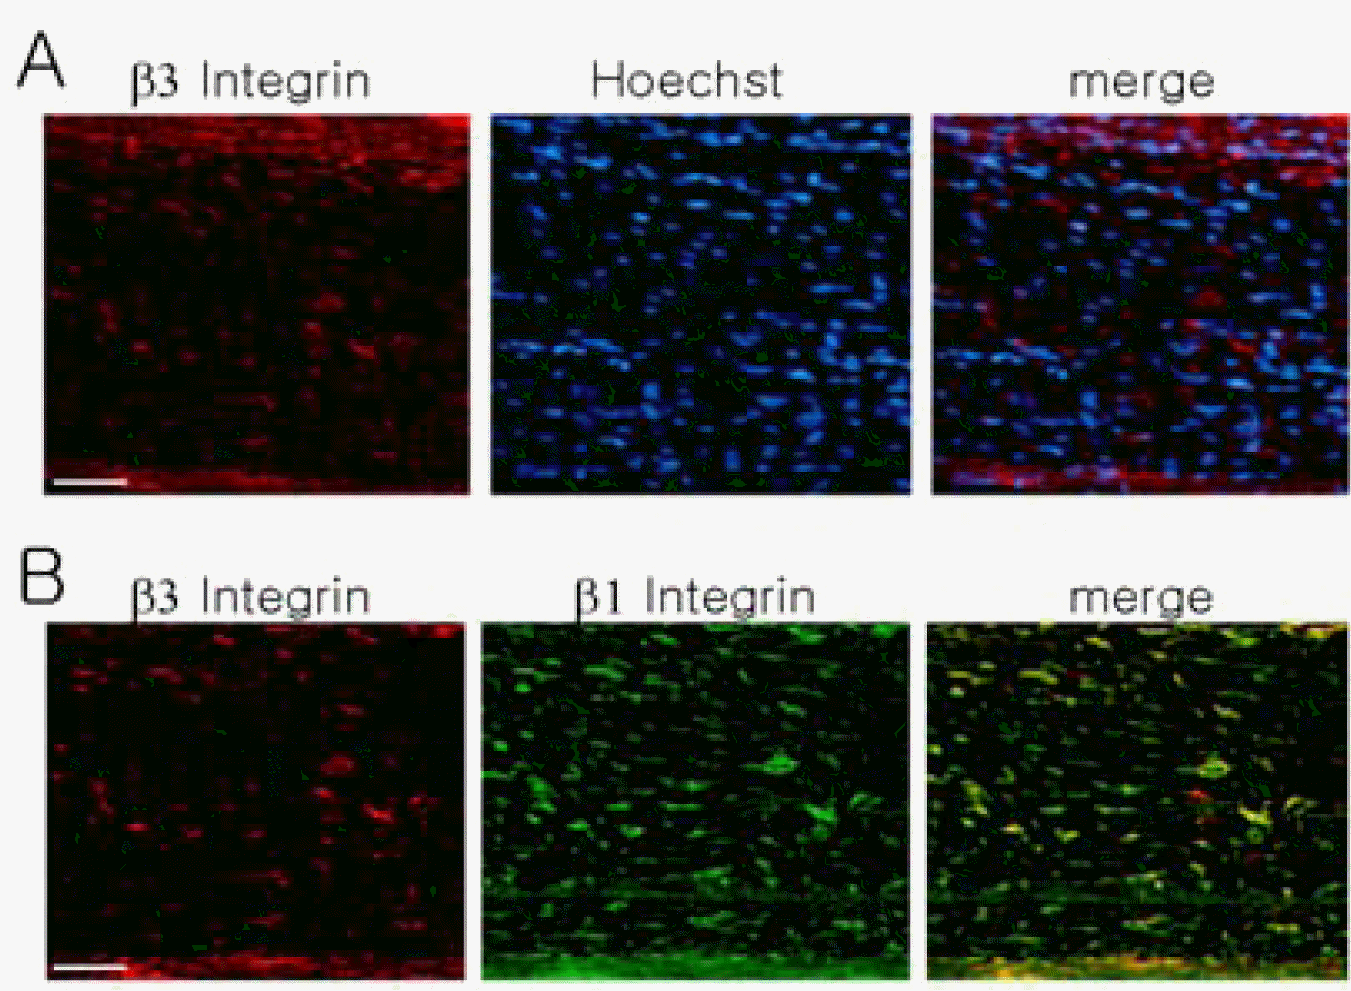
Double stained images of β 3 integrin in the nerves treated with STZ and BJT.
(A) Merged images of β3 integrin with Hoechst-stained nuclei. (B) Double immunofluorescence staining with β3 integrin proteins (red) and active β1 integrin (green). Scale bar in (A, B): 100μm.
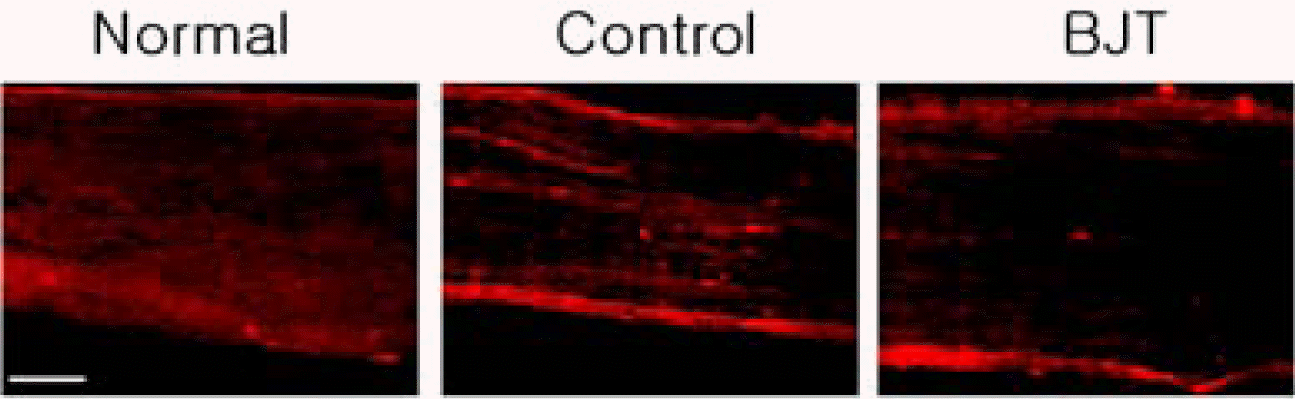
Immunofluorescence staining analysis of phospho-Smad signals in the longitudinal sciatic nerve sections.
Following treatments of STZ and BJT, sciatic nerve sections were used for immunofluorescence staining for phospho-Smad (in red).
Scale bar: 200μm.
Normal : non-treated group.
Control : STZ(200mg/kg) + saline
BJT : STZ(200mg/kg) + BJT(400mg/kg)
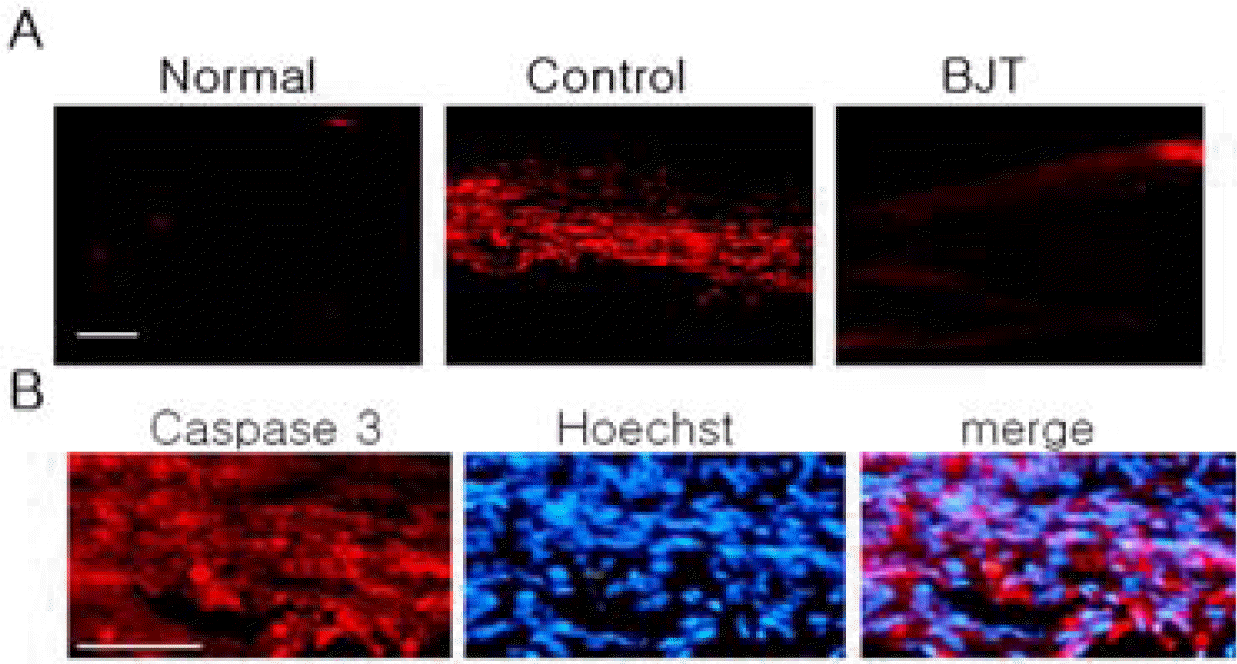
Immunofluorescence staining analysis of caspase 3 signals in the longitudinal sciatic nerve sections.
Following treatments of STZ and BJT, sciatic nerve sections were used for immunofluorescence staining for caspase 3 (in red). (A) Representative fluorescence staining images. (B) Merged images of β1 integrin with Hoechst-stained nuclei. Scale bar in (A, B): 200μm.
Normal : non-treated group.
Control : STZ(200mg/kg) + saline
BJT : STZ(200mg/kg) + BJT(400mg/kg)
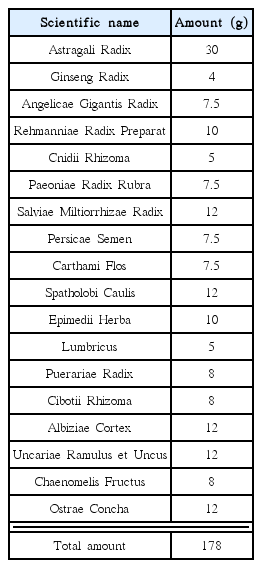
Prescription of Bogijetong-tang(BJT)