Home | Register | Login | Inquiries | Alerts | Sitemap |  


Advanced Search
JKM > Volume 39(2); 2018 > Article
Kim, Kwon, Go, Lee, Ko, and Kong: Study of Efficacy and Safety of Ginseng Seed Oil in Heathy Subjects Who Have Mild Liver Dysfunction: A Randomized, Double Blinded, Placebo-Controlled Study

Abstract

Objectives

The purpose of this study was to investigate the effectiveness and safety of ginseng seed oil in healthy subjects who have mild liver dysfunction.
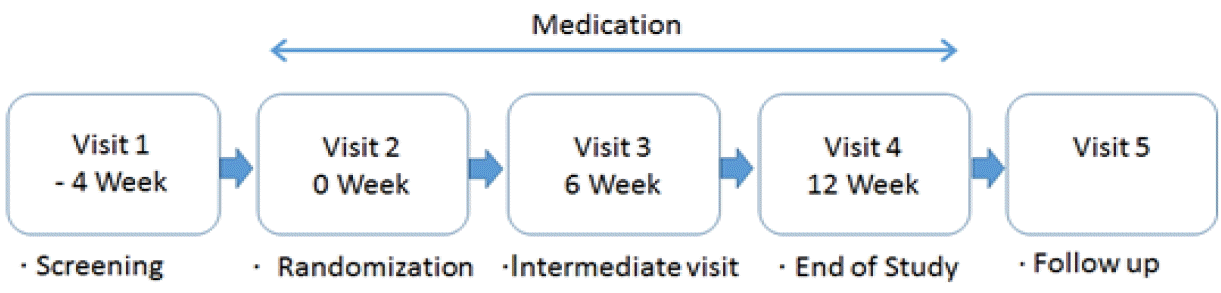
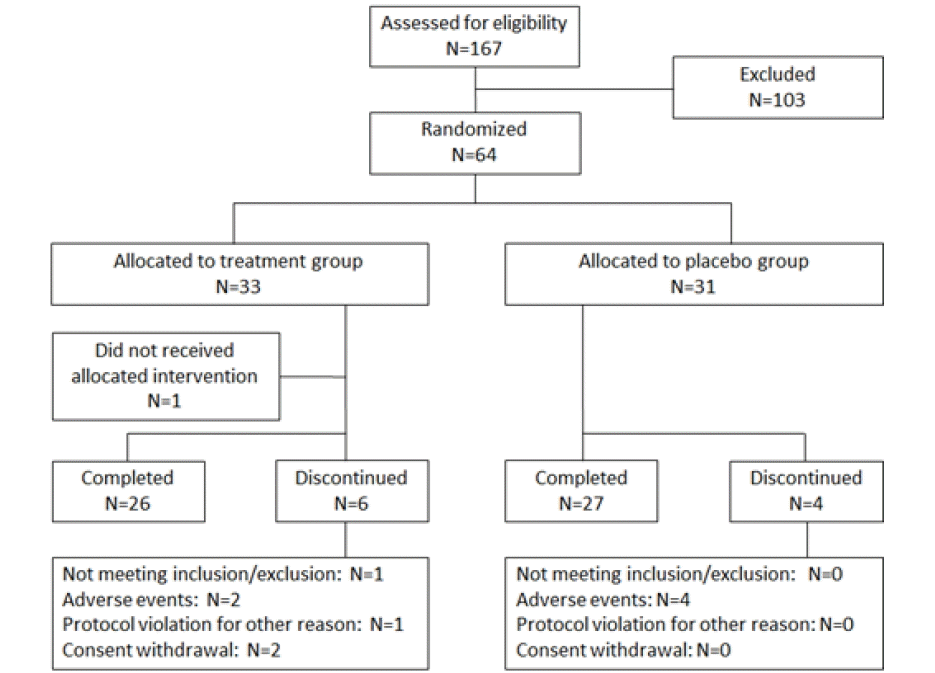
Methods

A randomized, double blinded, placebo-controlled trial was conducted. A total of 167 subjects visited Semyung University Hospital from July 1st, 2016 to June 10th 2017. Except for the 103 excluded subjects, 64 subjects were randomized into one of the two groups: an treatment group(n=33) and control group(n=31). Subjects were randomly given either ginseng oil seed capsules or indistinguishable placebo capsules(2 capsules per dose, twice per day). Laboratory tests(aspartate aminotransferase, alanine aminotransferase, gamma glutamyl transpeptidase, triglyceride, total cholesterol, high density lipoprotein-cholesterol, low density lipoprotein-cholesterol) were performed to evaluate the effectiveness after 6, 12 weeks of treatment. Vital sign, laboratory test were performed to assess safety at every visit.

Results

There were no significant differences in efficacy between treatment group and control group. There were some adverse events with no significant difference in symptoms and frequency between treatment group and control group.

Conclusions

Although the efficacy of ginseng seed oil was not proved, ginseng seed oil did not worsen liver function and proved its safety. More study of ginseng seed oil and clinical trials are necessary to increase the usefulness of above-ground parts of ginseng.

Fig. 1
Experimental design
jkm-39-2-36f1.gif
Fig. 2
Disposition of subjects, enrolled in the study
jkm-39-2-36f2.gif
Table 1
The Composition of GSO
% 750 mg
Ginseng seed oil 66.7 500
Pigskin gelatin 26.5 199
Glycerin 3.33 25
D-Sorbitol 3.33 25
Cochineal extract 0.07 0.5
Caramel color 0.07 0.5
Table 2
Characteristics of the Subjects
Characteristics Treatment(N=26)
n(%) or Mean±SD
Control(N=27)
n(%) or Mean±SD
p*
Age(year) 50.73±9.489 51.67±8.440 0.564
Gender
 Male 15(57.7) 13(48.1) 0.487
 Female 11(42.3) 14(51.9)
Height(cm) 165.731±10.7240 161.593±9.9817 0.442
Body weight(kg) 74.173±13.1612 69.607±12.7435 0.944
Smoking status
 Never 17(65.4) 18(66.7) 0.634
 Past 4(15.4) 6(22.2)
 Current 5(19.2) 3(11.1)
Alcohol intake
 Never or past 12(46.2) 16(59.3) 0.628
 Moderate 8(30.8) 6(22.2)
 Excessive 6(23.1) 5(18.5)
Meal
 Regular 25(96.2) 24(88.9) 0.317
 Irregular 1(3.8) 3(11.1)
Exercise
 Never 7(26.9) 6(22.2) 0.604
 Irregular 9(34.6) 13(48.1)
 Regular 10(38.5) 8(29.6)

Treatment : group taking GSO, Control : group taking placebo, N : number

* p: p-value between groups by independent t-test or chi-square test

Table 3
Change of Lab
Treatment(N=26) Control(N=27) p

Mean±SD p* Mean±SD p*
AST (IU/L) Baseline 33.88±5.750 31.41±5.970 0.130
6weeks 32.500±8.3391 0.263 28.889±7.4902 0.020 0.103
12weeks 36.885±21.8711 0.746 29.222±8.0734 0.071 0.094

ALT (IU/L) Baseline 38.885±17.1891 34.074±11.2760 0.232
6weeks 35.538±19.5576 0.179 35.222±15.6262 0.942 0.948
12weeks 42.077±28.0170 0.989 31.407±12.8998 0.140 0.079

γ-GTP (IU/L) Baseline 55.423±49.6823 48.704±48.2739 0.620
6weeks 48.731±41.0410 0.017 47.370±51.9824 0.439 0.916
12weeks 49.038±44.0958 0.012 43.111±42.5869 0.002 0.621

TG (mg/dL) Baseline 178.654±110.7025 179.074±146.9262 0.991
6weeks 197.692±132.2751 0.211 166.889±153.9076 0.210 0.439
12weeks 193.192±152.8105 0.657 182.148±190.5243 0.943 0.817

t.Chol (mg/dL) Baseline 192.077±33.5296 199.111±35.1342 0.460
6weeks 202.385±32.9740 0.042 211.000±33.6109 0.034 0.351
12weeks 207.462±38.7889 0.005 207.296±33.1045 0.100 0.987

HDL (mg/dL) Baseline 49.154±11.2452 50.778±13.9127 0.643
6weeks 49.885±11.6218 0.647 53.481±13.4718 0.173 0.304
12weeks 47.308±12.6262 0.567 53.148±14.0239 0.095 0.118

LDL (mg/dL) Baseline 116.450±40.6234 134.955±35.6671 0.124
6weeks 124.254±36.8828 0.369 133.562±33.6150 0.573 0.346
12weeks 124.654±39.2621 0.795 121.077±27.4079 0.024 0.705

Treatment: group taking GSO, Control: group taking placebo, N: number

AST: aspartate aminotransferase. ALT: alanine aminotransferase, γ-GTP: gamma glutamyl transpeptidase, TG: triglyceride, t.Chol: total cholesterol, HDL: high-density lipoprotein-cholesterol, LDL: low-density lipoprotein-cholesterol

* p: p-value for baseline vs post(6weeks, 12weeks) by paired t-test or Wilcoxon’s signed rank test

† p: p-value between groups by independent t-test

Table 4
Change of Lab in the Subject Except for People with Excessive Drinking
Treatment(N=20) Control(N=22) p

Mean±SD p* Mean±SD p*
AST (IU/L) Baseline 32.85±5.650 30.59±5.152 0.183
12weeks 32.350±10.7178 0.812 27.864±7.1200 0.041 0.115

ALT (IU/L) Baseline 36.900±16.7329 32.636±10.7062 0.327
12weeks 35.450±15.0909 0.481 29.545±12.1370 0.121 0.168

γ-GTP (IU/L) Baseline 37.000±16.9923 33.091±19.2920 0.492
12weeks 33.100±14.8391 0.111 30.545±24.2600 0.009 0.686

TG (mg/dL) Baseline 167.000±120.1411 148.045±102.3204 0.584
12weeks 157.450±130.4097 0.471 135.727±56.0715 0.987 0.480

t.Chol (mg/dL) Baseline 195.550±32.2775 196.818±37.7456 0.908
12weeks 207.550±40.8688 0.116 202.318±32.7143 0.317 0.648

HDL (mg/dL) Baseline 49.100±11.6750 51.000±13.3880 0.628
12weeks 48.650±3.2159 0.784 53.955±13.6538 0.077 0.209

LDL (mg/dL) Baseline 120.786±37.4005 139.824±38.4939 0.176
12weeks 124.143±34.2634 0.889 127.941±29.7373 0.042 0.474

Treatment: group taking GSO, Control: group taking placebo, N: number

AST: aspartate aminotransferase. ALT: alanine aminotransferase, γ-GTP: gamma glutamyl transpeptidase, TG: triglyceride, t.Chol: total cholesterol, HDL: high-density lipoprotein-cholesterol, LDL: low-density lipoprotein-cholesterol

* p: p-value for baseline vs post(12weeks) by paired t-test or Wilcoxon’s signed rank test

† p: p-value between groups by independent t-test

Table 5
Comparisons of Adverse Event Between Treatment Group and Control Group
Treatment(N=32) Control(N=31) p

n* (%) n n* (%) n
Treatment Emergent Adverse Events (TEAE) 8(25.00) 10 7(22.58) 9 0.8217
Adverse drug reaction(ADR) 2(6.25) 2 2(6.45) 3 1.0000
Unexpected adverse drug reaction(UADR) 2(6.25) 2 2(6.45) 2 1.0000
Serious adverse event(SAE) 0(0.00) 0 1(3.23) 1 0.4921
Adverse event influencing participant dropout 2(6.25) 2 3(9.68) 3 0.6719

Treatment : group taking GSO, Control : group taking placebo, N : number

* n: number of subjects,

† n: number of events

‡ p: p-value between groups by chi-square test or Fisher’s exact test

Table 6
Vital Sign
Vital sign Treatment (N=32) Control (N=31) p

Mean±SD p* Mean±SD p*
SBP (mmHg) Baseline 126.09±13.72 122.39±11.80 0.2183
Final visit 124.14±14.02 0.0993 123.79±11.15 0.4465 1.0000

DBP (mmHg) Baseline 80.16±7.67 79.68±7.52 0.8532
Final visit 78.62±7.89 0.2668 80.34±7.78 0.8145 0.4184

Pulse (beats/min) Baseline 71.84±9.78 73.45±11.16 0.5450
Final visit 69.28±7.38 0.2026 70.38±8.65 0.0600 0.6032

BT(°C) Baseline 36.44±0.14 36.51±0.19 0.2313
Final visit 36.55±0.23 0.0442 36.49±0.18 0.4103 0.1584

Treatment: group taking GSO, Control: group taking placebo, N: number

SBP: systolic blood pressure, DBP: diastolic blood pressure, BT: body temperature

* p: p-value for baseline vs final visit by paired t-test or Wilcoxon’s signed rank test

† p: p-value between groups by independent t-test or Mann-Whitney test

Table 7
Hematology
Hematology Treatment (N=32) Control (N=31) p

Mean±SD p* Mean±SD p*
WBC (103/μl) Baseline 5.96±1.43 6.00±1.56 0.9233
Final visit 5.98±1.79 0.8933 6.33±1.70 0.1803 0.3417

RBC (106/μl) Baseline 4.35±0.29 4.49±0.37 0.1021
Final visit 4.39±0.35 0.7236 4.36±0.40 0.0309 0.7765

Hgb (mg/dL) Baseline 13.78±1.49 14.22±1.38 0.3391
Final visit 13.97±1.47 0.9808 13.86±1.54 0.0205 0.9935

Hct (%) Baseline 39.45±3.49 40.74±3.33 0.1393
Final visit 39.86±3.51 0.9727 39.78±3.73 0.0385 0.9385

Platelets (103/μl) Baseline 241.25±48.35 236.19±53.47 0.6950
Final visit 229.71±49.21 0.3534 239.07±56.29 0.7242 0.4708

Treatment: group taking GSO, Control: group taking placebo, N: number

RBC: red blood cell, WBC: white blood cell, Hgb: Hemoglobine, Hct: Hematocrit

* p: p-value for baseline vs final visit by paired t-test or Wilcoxon’s signed rank test

† p: p-value between groups by independent t-test or Mann-Whitney test

Table 8
Blood Chemistry
Blood chemistry Treatment (N=32) Control (N=31) p

Mean±SD p* Mean±SD p*
ALP (IU/L) Baseline 74.44±25.17 71.71±16.26 0.6104
Final visit 81.00±23.53 0.0665 79.04±18.44 0.0109 0.7294

T.Bili (mg/dL) Baseline 0.23±0.12 0.22±0.11 0.7350
Final visit 0.22±0.10 0.5449 0.23±0.09 0.3060 0.5849

Total protein (mg/dL) Baseline 7.53±0.34 7.49±0.39 0.6584
Final visit 7.60±0.37 0.7057 7.5±0.34 0.9179 0.2814

Albumin (g/dL) Baseline 4.61±0.25 4.65±0.25 0.5737
Final visit 4.70±0.23 0.2858 4.69±0.22 0.6329 0.8596

AST (IU/L) Baseline 34.69±6.14 31.55±6.03 0.0326
Final visit 38.57±21.95 0.7432 29.46±8.03 0.1696 0.0411

ALT (IU/L) Baseline 38.66±16.55 34.90±11.27 0.2961
Final visit 42.71±27.11 0.6376 32.00±13.04 0.2923 0.0794

γ-GTP (IU/L) Baseline 53.09±46.84 50.94±48.77 0.6401
Final visit 48.39±42.69 0.0065 43.79±41.94 0.0052 0.3458

BUN (mg/dL) Baseline 16.22±3.70 14.97±3.72 0.2064
Final visit 15.68±3.58 0.3994 13.93±3.30 0.1235 0.0625

Creatinine (mg/dL) Baseline 1.00±0.21 0.90±0.19 0.0496
Final visit 1.04±0.19 0.3835 1.00±0.20 0.0148 0.5420

Glucose (mg/dL) Baseline 99.47±19.02 101.74±21.81 0.8365
Final visit 97.71±29.41 0.0857 93.21±21.01 0.0785 0.7805

Uric acid (mg/dL) Baseline 5.14±1.55 5.03±1.91 0.5869
Final visit 5.59±1.42 0.0160 5.01±1.80 0.8401 0.1881

TG (mg/dL) Baseline 171.09±101.72 180.52±147.93 0.6255
Final visit 192.00±147.56 0.6571 181.50±186.99 0.7393 0.6820

t.Chol (mg/dL) Baseline 189.63±32.82 203.68±35.69 0.0605
Final visit 206.04±39.05 0.0019 208.29±32.90 0.0769 0.8165

LDL (mg/dL) Baseline 116.00±38.39 140.20±36.95 0.0277
Final visit 123.82±38.56 0.5640 122.48±27.85 0.0136 0.8835

HDL (mg/dL) Baseline 49.63±11.07 50.55±13.81 0.7703
Final visit 48.07±13.40 0.9311 53.96±15.89 0.0338 0.1813

Treatment : group taking GSO, Control : group taking placebo, N : number

AST: aspartate aminotransferase. ALT: alanine aminotransferase, γ-GTP: gamma glutamyl transpeptidase, ALP: alkaline phosphatase, TG: triglyceride, t.Chol : total cholesterol, HDL: high-density lipoprotein-cholesterol, LDL: low-density lipoprotein-cholesterol

* p: p-value for baseline vs final visit by paired t-test or Wilcoxon’s signed rank test

† p: p-value between groups by independent t-test or Mann-Whitney test

Table 9
Comparative Analysis of Normal and Abnormal Urinalysis
Final visit Treatment (N=27) Control (N=27) p*

Baseline Normal n(%) Abnormal n(%) Normal n(%) Abnormal n(%)
pH Normal 27(100.0) 0(0.00) 27(100.0) 0(0.00)
Anormal 0(0.00) 0(0.00) 0(0.00) 0(0.00)

RBC Normal 19(70.37) 2(7.41) 23(85.19) 0(0.00) 0.4889
Anormal 4(14.81) 2(7.41) 2(7.41) 2(7.41)

WBC Normal 25(92.59) 1(3.70) 20(74.07) 3(11.11) 0.3507
Anormal 0(0.00) 1(3.70) 3(11.11) 1(3.70)

Protein Normal 27(100.0) 0(0.00) 26(96.30) 0(0.00)
Anormal 0(0.00) 0(0.00) 1(3.70) 0(0.00)

Glucose Normal 26(96.30) 1(3.70) 26(96.30) 1(3.70) 1.0000
Anormal 0(0.00) 0(0.00) 0(0.00) 0(0.00)

Specific gravity Normal 26(96.30) 0(0.00) 27(100.0) 0(0.00)
Anormal 0(0.00) 0(0.00) 0(0.00) 0(0.00)

Treatment: group taking GSO, Control: group taking placebo, N: number

RBC: red blood cell, WBC: white blood cell

* p: p-value between groups by Fisher’s exact test

참고문헌

1. Ko SK, Kim YS, Kim YY, Kim JK, Mok SK, Park JD, et al. The understanding of Korea ginseng. Seoul: The publishing company of Chung-Ang university;2005. p. 10


2. Sung HS. Present and future on the processing of ginseng. Journal of Ginseng Research. 1986; 10:2. 218–32.


3. Kim JH, Chang EJ, Oh HI. Effects of media and growth regulators on the growth and saponin production of ginseng root. J Ginseng Res. 2001; 25:3. 130–5.


4. Chi HJ, Kim HS. The production of ginseng saponins with the cell culture of Korean ginseng plant. Kor J Pharmacogn. 1985; 16:3. 171–4.


5. Kang HC. Studies on the enhanced dermal anti-aging efficacy of bioconverted ginsenosides from aerial parts of Panax ginseng. Doctor’s Thesis. Suwon: Ajou Univ;2015.


6. Kim CM, Shin MK, Ahn DK, Lee KS. The Encyclopedia of Oriental Herbal Medicine. Seoul: jeongdam;1997. p. 3491–3.


7. Xie JT, Shao ZH, Vanden Hoek TL, Chang WT, Li J, Mehendale S, et al. Antioxidant effects of ginsenoside Re in cardiomyocytes. European J Pharmacol. 2006; 532:3. 201–7.


8. Choi SY, Cho CW, Lee YM, Kim SS, Lee SH, Kim KT. Comparison of ginsenoside and phenolic ingredient contents in hydroponically-cultivated ginseng leaves, fruits, and roots. J Ginseng Res. 2012; 36:4. 425–9.


9. Choi JE, Li Z, Han YH, Lee KT. Changes of saponin contents of leaves, stems and flower-buds of Panax ginseng C. A. Meyer by Harvesting Days. Korean J Medicinal Crop Sci. 2009; 17:4. 251–6.


10. Kim SC, Choi KJ, Ko SR, Joo HK. Purifying effects of fat-soluble solvents in extracting saponins from ginseng root, leaf and stem. J Korean Agri Chem Soc. 1987; 30:4. 335–9.


11. Xie JT, Wang CZ, Wang AB, Wu J, Basila D, Yuan CS. Antihyperglycemic effects of total ginsenosides from leaves and stem of Panax ginseng. Acta Pharmacologica Sinica. 2005; 26:9. 1104–10.


12. Wang CZ, Wu JA, McEntee E, Yuan CS. Saponins composition in American ginseng leaf and berry assayed by high-performance liquid chromatography. J Agric Food Chem. 2006; 54:6. 2261–6.


13. Lee HJ, Seo HJ, Le HS. A study on the utilization of enzyme treated ginseng leaf for cosmeceutical ingredient. Kor J Aesthet Cosmetol. 2010; 8:3. 59–69.


14. Chang JH, Hwang SH, Lee EJ, Ohto N, Lee JH. Effect of Panax ginseng C.A. Meyer extract (Ginseol K-b1) on UVB-induced skin damage in hairless Mice. J East Asian Soc Dietary Life. 2012; 22:2. 224–30.


15. Jeon JM, Choi SK, Kim YJ, Jang SJ, Cheon JW, Lee HS. Antioxidant and antiaging effect of ginseng berry extract fermented by lactic acid bacteria. J Soc Cosmet Scientists Korea. 2011; 37:1. 75–81.


16. Lee AR, Park JH. Antioxidant and hepatoprotective effects of hydroponic-cultured ginseng folium by fermentation. Kor J Herbol. 2015; 30:4. 101–8.


17. Park SH, Sihn EH, Park SJ, Han JH. Ginsenoside contents and hypocholesterolemic effects of a by-product in ginseng radix. Korean J Oriental physiology & Pathology. 2005; 19:2. 459–465.


18. Lee KS, Seong BJ, Kim SI, Han SH, Kim HH, Won JY, et al. Changes of fatty acids, minerals and ginsenosides on ginseng seeds during stratifying treatment. Korean J Medicinal Crop Sci. 2015; 23:5. 406–13.


19. Wolańska D, Kłosiewicz-Latoszek L. Fatty acids intake and serum lipids profile in overweighted and obese adults. Rocz Panstw Zakl Hig. 2012; 63:155–62.


20. Wanders AJ, Brouwer IA, Siebelink E, Katan MB. Effect of a high intake of conjugated linoleic acid on lipoprotein levels in healthy human subjects. PLoS One. 2010; 5:2. e9000


21. Song JH, Shon MS, Kim HO, Kim JS, Kim ES, Kim GN. Anti-oxidant activity of oil extracted from ginseng seed. Kor J Aesthet Cosmetol. 2014; 12:2. 235–40.


22. Lee JH, Lee SS, Ahn IO, Kang JY, Lee MG. Relationship between storage periods and germination ability of dehisced seeds of Panax ginseng C. A. Meyer. J Ginseng Res. 2004; 28:4. 215–8.


23. Lee CK, Han YN, Kim NY, Choi JW. The Therapeutic effects of Korean red ginseng on carbon tetrachlorideand galactosamine-induced hepatotoxicity in rats. J Ginseng Res. 2003; 27:1. 11–6.


24. Hong SH, Cho JH, Son CG. Analytic study for alcohol consumption-related parameters in 53 heavy drinkers. Korean J Orient Int Med. 2007; 28:1. 115–23.


25. Powell EE, Cooksley WG, Hanson R, Searle J, Halliday JW, Powell LW. The natural history of nonalcoholic steatohepatitis: a follow-up study of forty-two patients for up to 21 years. Hepatology. 1990; 11:1. 74–80.


26. Kim IR, Kim HC, Guk YB, Park SJ, Park YG, Seo BI, et al. Bonchohak. Seoul: Yeongnimsa;2004. p. 573–6.


27. Park JD. Recent studies on the chemical constituents of Korean ginseng. Korean J Ginseng Sci. 1996; 20:4. 389–415.


28. Han JH, Park SH. Study of medicinal herbs for applications in functional foods-Antifatigue effects and safety evaluation of leaf and stem extract of the Panax ginseng. Korean J Oriental Physiology & Pathology. 2004; 18:4. 1134–39.


29. Chung AS, Cho KJ, Oh JH, Park JD. Pharmacological and physiological effects of ginseng. Journal of Korean Association of Cancer prevention. 2004; 9:3. 125–38.


30. Kim JK, Kim BS, Park CW, Seo DB, Yoo HR, Lee SJ. Effect of ginseng-berry extract on the improvement of blood microcirculation and skin brightness. Korean J Oriental Physiology & Pathology. 2010; 24:1. 85–90.


31. Ko SK, Bae HM, Cho OS, Im BO, Chung SH, Lee BY. Analysis of ginsenoside composition of ginseng berry and seed. Food Sci Biotechnol. 2008; 17:6. 1379–82.


32. Beveridge THJ, Li TSC, Drover JCG. Phytosterol content in American ginseng seed oil. J Agric Food Chem. 2002; 50:4. 744–50.


33. Ahn CH, Nam YM, Kim SJ, Yang BW, Kim HC, Ko SK. Inhibitory effects of ginseng seed oil on α-glucosidase and α-amylase activity. Kor J Pharmacogn. 2016; 47:1. 24–8.


34. Kim SY, Kim YC, Byun SJ, Kim E. The effect of ginsenosides on galactosamine-induced hepatotoxicity. Kor J Pharmacogn. 1991; 22:4. 219–24.


35. Joo CN, Tae GS, Joo SO, Cho KS. The effect of saponin fraction of Panax ginseng C.A. Meyer on the liver of ethanol administered rat. Korean J Ginseng Sci. 1985; 9:1. 1–8.


36. Koo KH, Joo CN. Clinical study on the efficacy of Panax ginseng C. A. Meyer on acute viral(B) hepatitis. Korean J Ginseng Sci. 1983; 7:2. 125–32.


37. Kim GH, Seong BJ, Kim SI, Han SH, Kim HH, Lee KS. Yield and quality characteristics of ginseng’s first byproducts. Korean J Medicinal Crop Sci. 2011; 19:5. 313–8.


38. Lee KS, Kim GH, Seong BJ, Kim SI, Han SH, Lee SS, et al. Quality characteristics of Yakgwa added with ginseng gruit, leaf and root. J Korean Soc Food Sci Nutr. 2013; 42:12. 1981–7.


39. Seo JY, Kim JR, Yoo BY. Interpretation of liver function tests. Korean J Fam Pract. 2012; 2:207–13.


40. Ahn CH. Studies on characteristic compounds and anti-diabetic physiological activities of ginseng seed. Master’s Thesis. Semyung Univ;2016.


TOOLS
PDF Links  PDF Links
Full text via DOI  Full text via DOI
PubReader  PubReader
Download Citation  Download Citation
  Print
Share:      
METRICS
1
Crossref
3,254
View
160
Download
Editorial office contact information
3F, #26-27 Gayang-dong, Gangseo-gu Seoul, 157-200 Seoul, Korea
The Society of Korean Medicine
Tel : +82-2-2658-3627   Fax : +82-2-2658-3631   E-mail : skom1953.journal@gmail.com
About |  Browse Articles |  Current Issue |  For Authors and Reviewers
Developed in M2PI